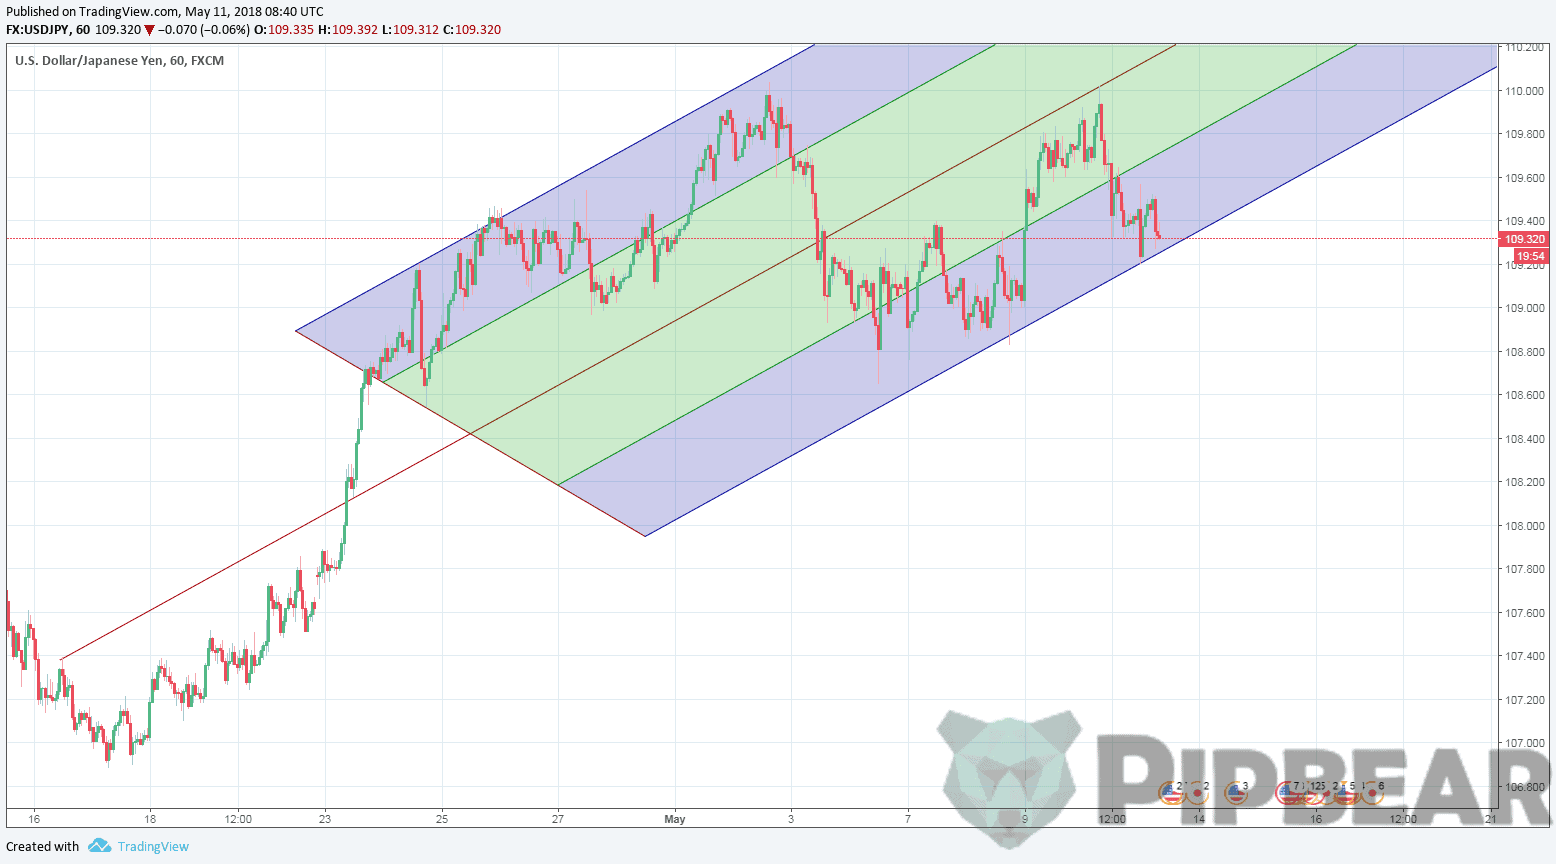
Andrew’s Pitchfork Indicator is a classic indicator that displays trend lines, forming the actual price channel on the chart. Two last perform the resistance/support levels functions. The system was called such a way because of a certain chart similarity with the same agricultural tool. Andrews was a well-known trader and the theorist is the strategy developer. The method was introduced firstly in the sixties of the last century after the author moved away from active trade and engaged in teaching activities. That’s why we can assume the indicator was invented and tested a few decades earlier.
Before reading the article and writing your questions in the comments section, I recommend to watch this video. It’s not long but covers the biggest part of questions on the topic.
Some traders are skeptical about Andrews’ Pitchfork while considering this tool to be an outdated indicator. This is their right. But even the world-class scientists are obliged to be familiar with the primary school training basics in their specialty.
Everyone who wants to be engaged in trading professionally should be familiar with the building methodology and correctly read this program chart. So, let’s start. Trend lines can be used in all markets and any time scales (Figure 1).

The price should always bounce off the upper resistance level if the trend is downward. When having an uptrend, it pushes from the bottom support line (Figure 2). Each such rebound is a potential entry point into the market by the movement direction.

How to use Andrew’s Pitchfork indicator
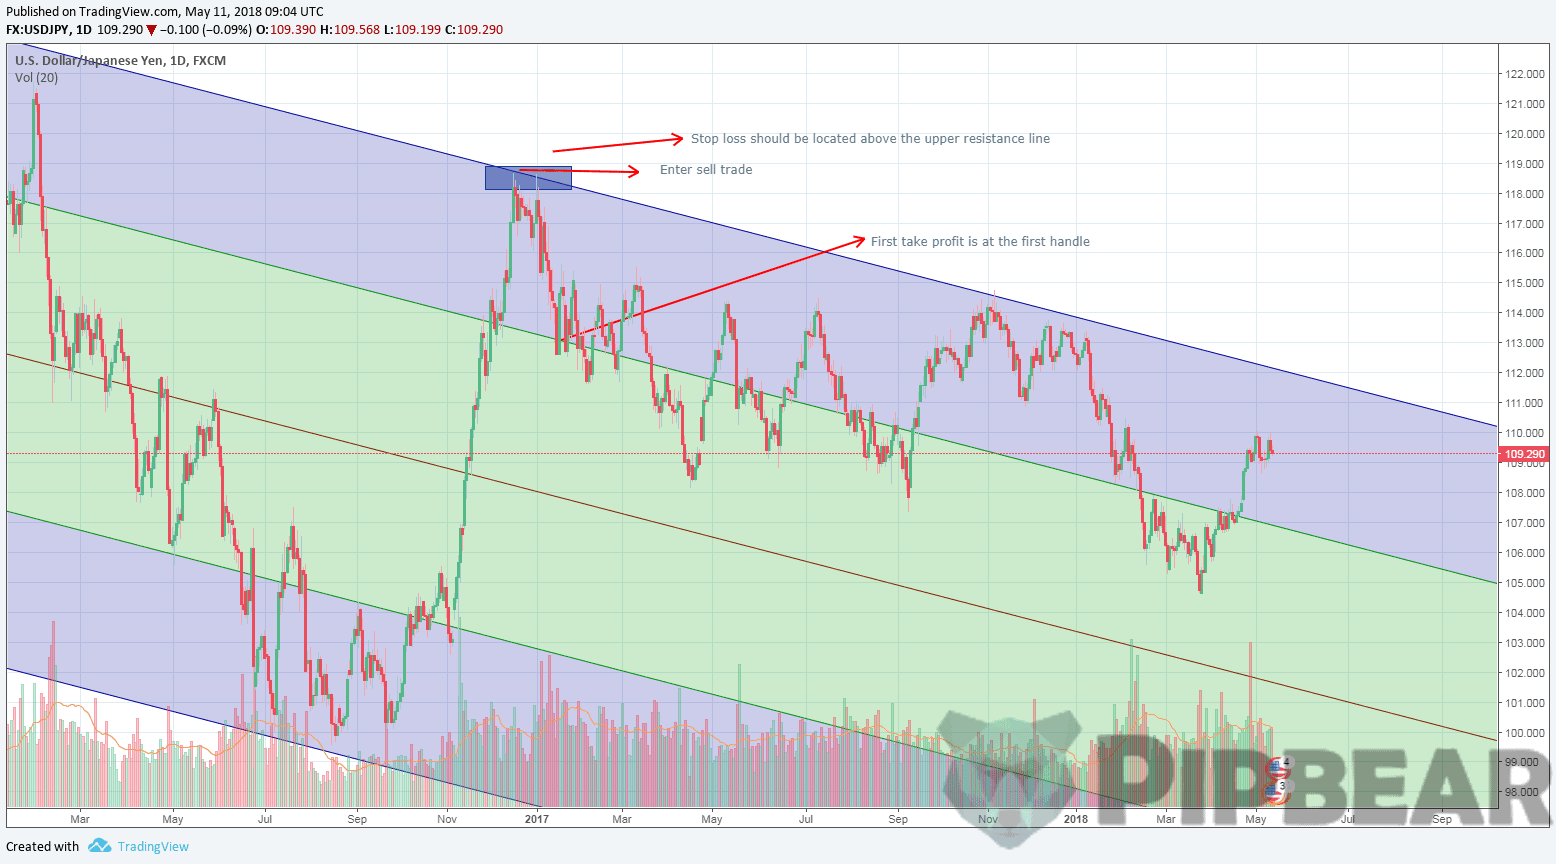
However, a signal for sale may not arise at all if using the classical approach and if the market continues to develop an upward trend. Accordingly, there are no calls to buy when having a steady downtrend. As can be seen in Figure 3, Andrew’s Pitchfork should be charted in downtrend price action in such a way that the upper resistance line keeps price action below it. Hence, it acts as the highest level of resistance in the current pitchfork setup.

Andrew’s Pitchfork Indicator application allows receiving opposite messages within one trend. The «teeth» are the resistance/support levels, as it has already been mentioned above. Approaching the price to the bottom line opens up the opportunities for the buyers while the approach to the upper boundary is the time to think about selling.
Before starting Andrew’s Pitchfork Indicator building, it is recommended to wait for a serious current trend correction. Next, it’s necessary to select three consecutive extremes on the chart. If it is an upward trend, the order will be as follows: minimum — maximum — minimum. The first line is drawn from the initial point through the middle of the segment joining the second and third extremums. Thus, we get the median or «handle» of the Pitchfork.
Teeth are built through the remaining points parallel to it. There are other building ways, which may seem preferable. Traders decide themselves which option to choose. Anyway, the modern programs relieve users of the worries related to the most suitable point’s determination. Andrew’s Pitchfork Indicator is present in most trading platforms, so just select the desired item in the section. The necessary calculations will be made automatically. Usually corrections take place at Fibonacci levels, so Pitchfork can be fully perceived as inclined Fibonacci lines.
The way to apply Andrew’s Pitchfork Indicator
Trading inside a channel can have quite good results on short stretches. We can say the current trend continues while price movement occurs within these limits. A breakthrough abroad is a clear signal of the changes starting. If it is confirmed by a similar action relative to the trend line on the price chart, the trend reversal can be considered to be happening.
Alan Andrews was sure the price comes back to the median line in most cases. His trading strategy is this axiom-based. Figure 4 shows how to trade this indicator and make a profit. So, a trend for purchase opens immediately after the signal regarding the fact the price pushed off from the upper border was received. Closing is carried out either at the first touch with the Pitchfork’s «handle» or when approaching it (trailing stop is used).

Further, the price either fights off the median or moves further towards the next support/resistance level. However, the price doesn’t always reach the middle line after the rebound. This can be related to either a trend change or an incorrect indicator building.
Anyway, in such a situation a trader can make one of the following decisions:
- just close the trade;
- open the opposite position at the same time;
- wait for the candle closure while expecting the price will remain within the channel’s boundaries;
- pull up stops in break-even (better even with profit);
There is no unequivocal answer here. Everyone acts by his own experience and strategy options. It is important to note that, according to A. Andrews, the price inability to reach the middle after the rebound, as a rule, result in breaking the border which is pushed away from. If this event occurred about the upper boundary, there is a signal to buy. Beforehand, it’s better to wait for the candle to closure. Stop in this case is usually set at the median line’s level. The trade for sale is opened if the lower limit has been broken.
Conclusion
Andrew’s Pitchfork Indicator concept is based on the fact that price’s behavior inside a corridor designated in such a way is predictable in 80% of cases.
Hence, we have an opportunity to count on the successful completion of four of the five transactions if having a correct entry into the position. Such performance looks impressive, but let’s not delude about this. It’s rather risky to hope for Andrew’s Pitchfork Indicator can work on its own. The best way is to pair it with other indicators.
However, this applies to the vast majority of modern indicators. A combination with other analysis tools is always more reliable and effective, provided that it is sufficiently harmonious. Andrew’s Pitchfork Indicator proved its reliability as a separate trading system component.


Useful piece! Would you like to explain about use of different type of pitchfork like schiff, modified & inside pitchfork
Nicely put; thank you.
Excellent tutorial, Plain, Concise, and Uncluttered. I’ve watched Several Other tutorials trying to figure out the Pitchfork, now it Makes sense, and I now see how to use it. Thank You!
You got me into pitchforking – thanks its greatly improved my style
These lines are amazing. I have been using them for over 20 years
Thaks for showing the indicator how to use and works!
Great education today. Thank you so much.
I have a question about Andrews Pitchfork Tool. When you are plotting the three points do you use the shadow of the Candle Stick or not…? Any thoughts would be appreciated. Thank you for your excellent trading content.
Thanks very much for your superb piece I am so thrilled with everything I am learning. Today I did not trade but I did spend like 12 hours behind my computer watching the EURUSD. Yesterday I drew a pitchfork on the 4h chart and the market reacted to it throughout the whole day ,beautiful! Also something funny happened.