The Currency Power Meter indicator is an algorithm that characterizes the mutual strength of currencies or currency pairs.
When added to your chart, Currency Power Meter will show the relative strength of a financial instrument over a given period (H4, day, etc.).
This tool will be useful for different categories of traders, including day, long-term, and swing traders. Plus, it gives alert signals.
Table of Contents
About Currency Power Meter
For impressive trading results, you need to correctly assess the strength of a financial instrument in the current market situation. The finance market is a dynamic environment affected by a great number of factors. To find a potentially lucrative currency pair, you need to know how strong it is compared to other currencies, both in cross currency pairs (crosses) and major currency pairs (with USD).
The relative market strength of an underlying asset is determined by the interests of big market players, trading mood, and major fundamental factors. Currency Power Meter is a perfect choice to measure the strength of a currency based on the current situation.
Luckily for a trader, the indicator is amazingly easy to work with. Its calculation formula takes into account tick volume and price movement, ensuring accurate and objective results. Simple settings and intuitive interface make Currency Power Meter an indispensable tool for any trader.
Check out the main characteristics of Currency Power Meter:
- works in any timeframe;
- shows the mutual strength of main currencies in real-time;
- considers both changes in price and tick volume;
- you can add and remove calculated quotes.
On a chart, the Currency Power Meter is plotted as two histograms with numerical values of currency strength.
For each currency, the indicator shows two histograms:
- narrow histogram;
- wide histogram.
The wide histogram shows the strength of a currency in the D1 timeframe, whereas the narrow one characterizes the strength of a currency in lower timeframes.
Setup and trading methods
How to install and set up Currency Power Meter
Now let’s find out how to set up and install the indicator on your trading platform. Currency Power Meter is compatible with MT4 and MT5.
First download Currency Power Meter to your computer. The indicator is usually available as a .mq4 file with a source code. Place the source file to the “Indicators” folder in your trading platform: Insert – Indicators – User – Currency Power Meter.
Now let’s take a look at the settings. The setup window looks like this:
Customize the following parameters:
- Hours. You need to set the low timeframe (from М5 to Н1);
- output. You need to select the financial instruments that will be displayed on a chart. The default list includes all major currencies but you can customize the list as you please.
- stairs. This is the list of cross and major currency pairs. The indicator will use this list to source data for analysis.
Also, you can change the colors used by the indicator.
Once you’ve set up all the required parameters, you’ll see the Currency Power Meter panel in the lower right corner of a chart. The panel displays the currencies you’ve selected in the output field. Each currency has two histograms.
Note that you can only change the lower timeframe (i.e. the narrow histogram). The higher timeframe (the wide histogram) is D1 by default.
Attention! Please note that D1 is the highest timeframe Currency Power Meter works with.

There is a value displayed in front of each histogram. It shows the strength of a currency on a scale from 1 to 10. The larger the number, the stronger the currency.
How to use Currency Power Meter in trading
To identify the direction of a currency pair, you need to analyze the values of the currencies that make it up.
Let’s take an example. Suppose, we’re trading EUR/USD. The value of EUR is 4.7. The value for USD is 5.1. Since the bears are stronger in EUR, there is a high probability of a breakout downwards.
This is how you can use Currency Power Meter to assess the probability of a pullback or breakout. It’s a good idea to pair Currency Power Meter with an oscillator showing oversold zones. In the chart below, the values predict that EUR/USD will go down and break the 1.30765 level.
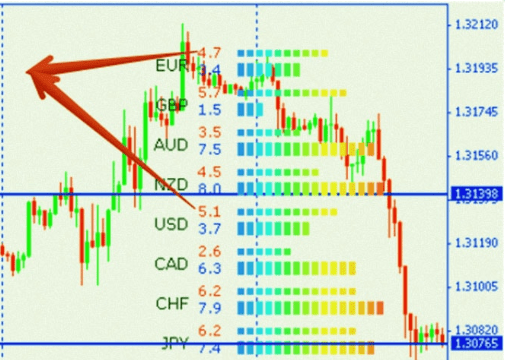
The color spectrum of a histogram (from cold to warm colors) and its length indicate the trading potential of a financial instrument.
According to the red values, AUD/USD will move downwards in the H1 timeframe. According to the blue values, AUD/USD will go up in the D1 timeframe.
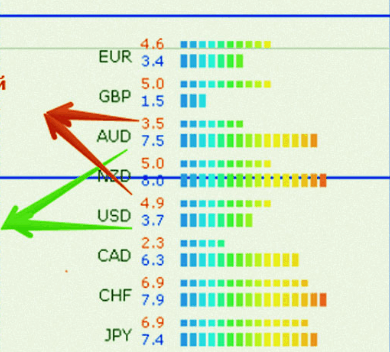
The values 8 and 2 are considered to be critical. Plus, pay attention to the difference between the values of the currencies in a pair. The bigger the absolute difference, the stronger the trend. If the difference hovers around 2, the trend is weak. If the difference comes close to 8 or even exceeds this value, the trend is losing steam and the chance of a reversal is high.
It’s important to understand that the Currency Power Meter doesn’t generate trading signals. It’s only task is to provide valuable information that helps you open high-profit trades.
With this indicator, you can detect dynamics after a continuous consolidation (dramatic increase in the indicator value) and analyze unconventional market situations.
Let’s analyze a sudden spike in a GBP/USD chart (see below). There were no objective reasons (technical signals, news releases, etc.) for a price to make such a leap.
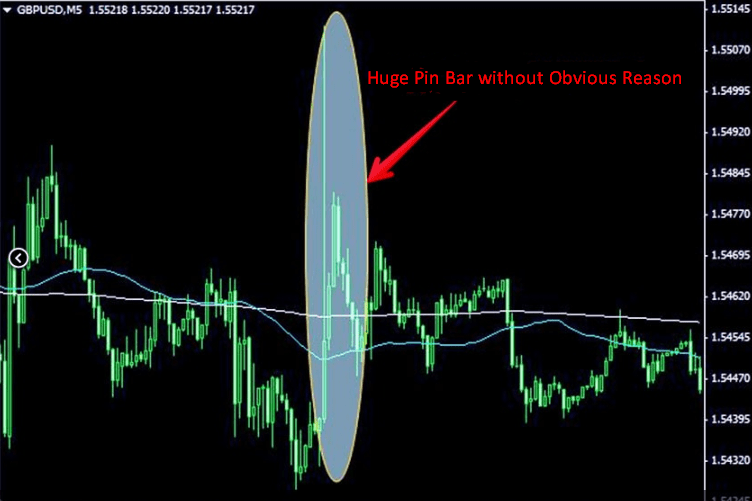
At the same time, EUR/USD showed no signs of volatility.
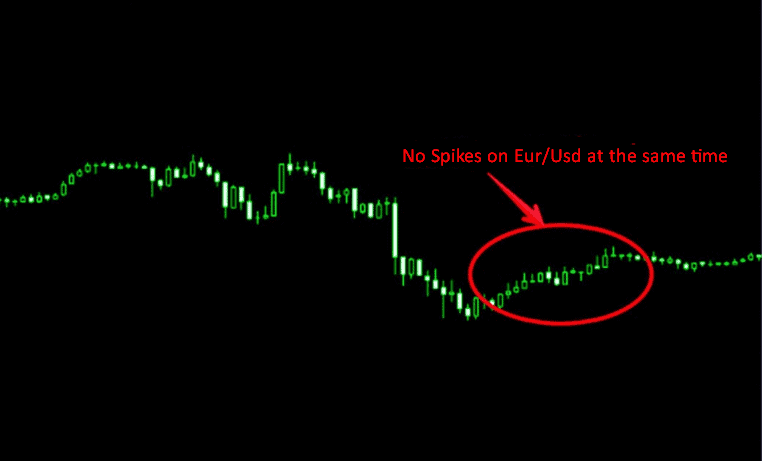
Imagine the panic attack among those trading GBP!
What was the reason behind the spike and what to expect in the future?
We should look for an answer in a EUR/GBP chart. Following a lengthy consolidation period and the breakout of a lower level, a price hit a big number of stop losses, which caused the crosses to make a 50-pip leap.
As a result, GBP moved about 70 pips in both directions in just a few minutes.
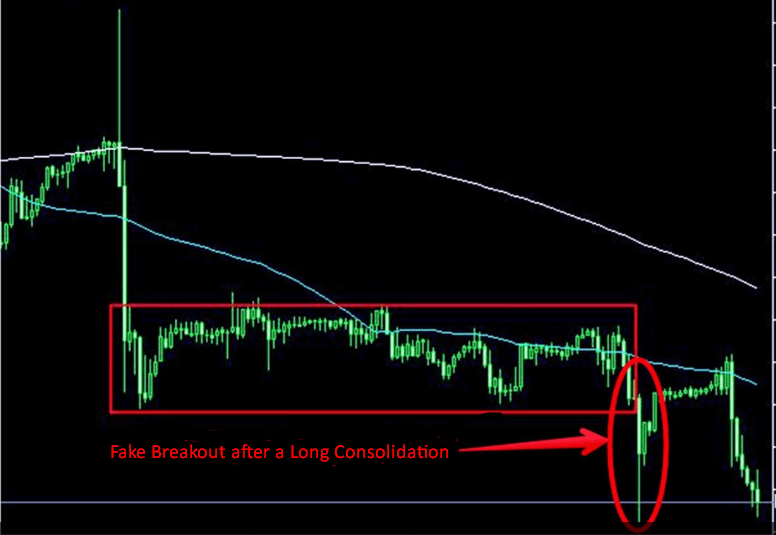
With Currency Power Meter, you won’t be caught off guard by such price leaps. If you had used Currency Power Meter in the situation described above, the strength of GBP/USD and crosses would have increased drastically and the strength of EUR/USD would have remained the same. By looking at the values, you’d understand that the spike was initiated by the crosses and therefore was sporadic. You could have just waited out or profited from the GBP/USD leap.


Where can I get the currency strength meter
i want the indicator
How can I purchase this indicator?
How can I get the indicator
How do i get this indicator