

I am sure you have heard that “The trend is your friend”. However, sometimes we all feel like trading against the trend… I mean, the pullbacks sometimes may seem to be large and easy to get.
Before reading the article and writing your questions in the comments section, I recommend to watch this video. It’s not long but covers the biggest part of questions on the topic.
The first impression is deceiving as it is much more difficult to trade against the trend and you may be extremely careful and quickly enter into a trade with the short stop-loss order if possible. What should you pay attention to while entering the market? What goals and stop orders should you set? What is the secret point of entering the market? We shall discuss it in the new lesson devoted to the Price Action strategy.
Table of Contents
Can We Trade Against the Trend? If We Can, How to Do It Right?
Greetings, ladies and gentlemen! This lesson will be devoted to trade against the trend. It is quite a dangerous activity since it often results in a loss. However, sometimes you just feel like entering into a transaction though it goes against the trend.
I would not advise you to trade against the dominating trend in general. However, if you eventually decide to do it, then do it right!
Let’s talk about how to get it right.
Why Is It Insecure to Trade Against the Trend?
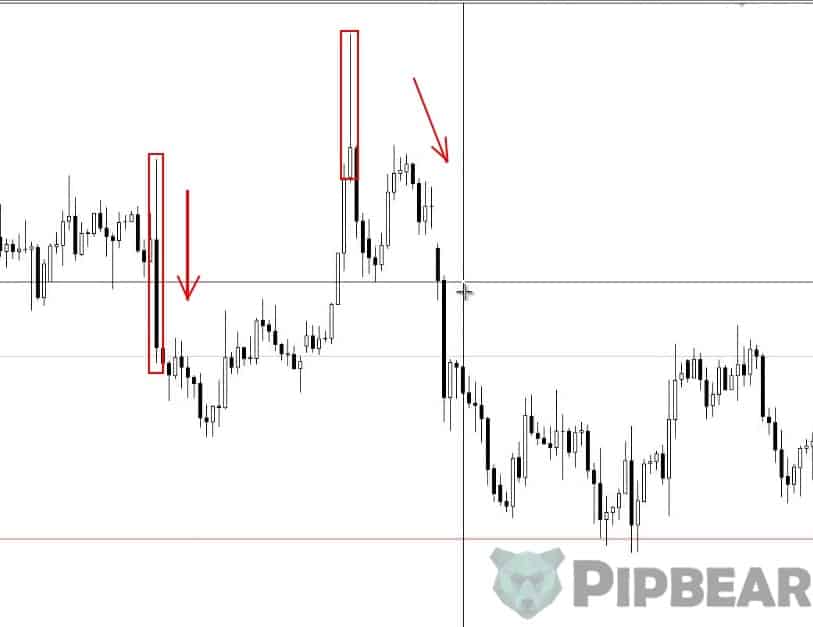
The thing is that when we look at the chart history that has already happened, we do not see the live prices. We pay attention to the extremes but we miss what preceded them.
We see a setup at the top so we could have entered into the transaction and get a fine profit.
It seems like trading against the trend might be flourishing at best. However, the truth is that we miss the moments when the price was moving up for some time and drew a setup, and nonetheless continued to move in the same direction. So if we had entered the market at that moment, we would have lost many pips and consequently a lot of money.
Let’s Have a Look at How It Happens
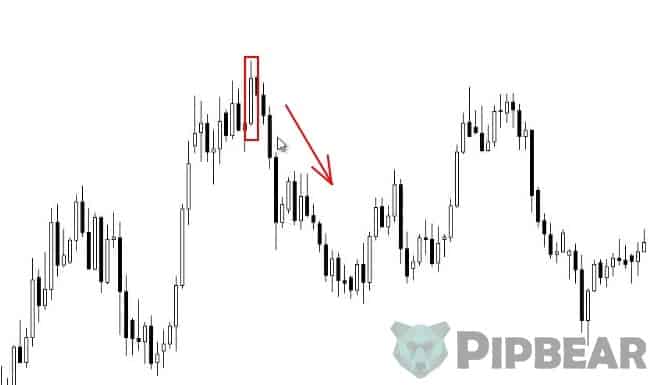
Here is the USDCAD currency pair chart. What do you see? You see the trend that has been moving upwards for quite a while. One would think that the price has grown enough and the pin-bar is about to appear. It looks like a good time to entering into a transaction and start selling.

What Would Have Happened if You Had Entered into the Sell Trade?
And… We see another strong bar moving upwards. Let’s take it in 100-pips of possible loss. So that’s what would have happened if you had started to sell. Now, look at what comes next. Another bar appears. Then you get one more pretty long bar moving upwards. Then the pin-bar finally takes place. Most traders would decide to sell right away!

Why Do You Need to Be Extremely Careful at this point?
Many traders lose their deposits in such situations since the movement coming after that is not the movement they have expected… Now the Doji moving down has occurred. If you had entered into a transaction using a pending order, i.e. setting a pending selling order a bit below the low point of the pin bar, then you would get increased sales. Well, you have entered the market. Will you get a profit or a loss? The price has gone up a bit but we all remember that according to the pin bar rules, you should put the stop-loss order above its tail. In this case, the price has not broken out the top (the tail). Now, wait. Here comes another neutral candlestick. And after that you will finally see another pin bar that has broken out our stop-loss order.
What Would Have Happened if You Had Entered at the Previous Pin Bar?
What would have happened if you had considered that moment a 100% chance to enter the market? Some traders increased the lot being sure that a strong downtrend would occur. The price cannot go up all the time after all. So now you get another pin bar and a bullish candlestick the next day. The price grows by another 120 pips. Then another pin appears. Now you think that it is a 1000% guarantee that the price will go down! No more pin bars! Now you will see a strong pullback! Yes, now the price is supposed to collapse. Let’s say that you are starting to sell right now. The price has slightly gone down. If you had placed a pending order, it would have been activated now. Another neutral bar is coming and…
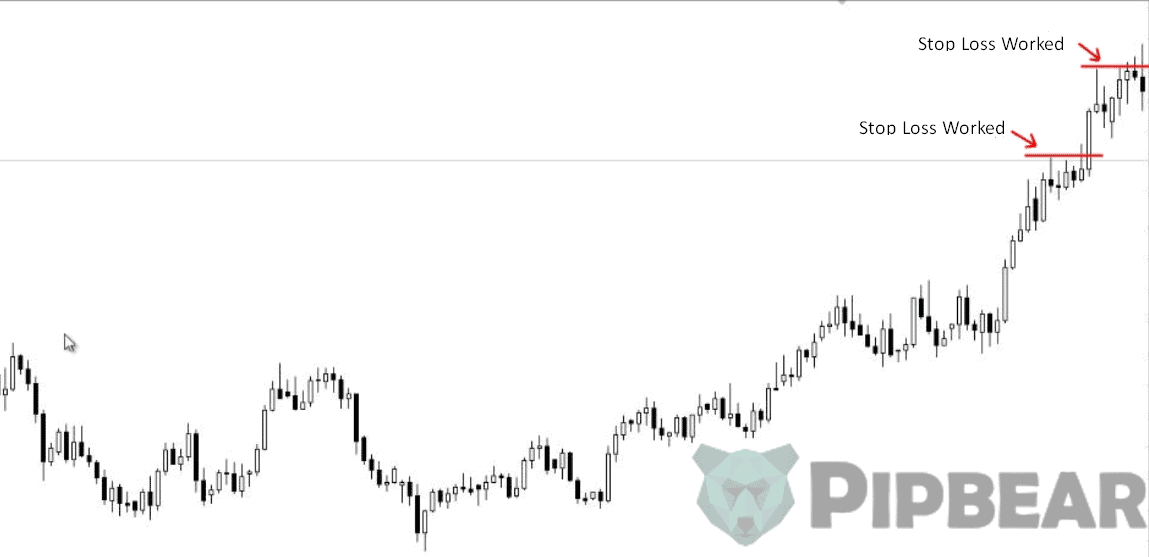
And our stop-loss order is broken out again! Now you can see the Doji forming.
Do you get it now why the entries against the trend are so insecure?
That’s because we all pay attention only to the extremes while looking at the chart history. Of course, all the set-up made on them are profitable since they are extremes.
The price did go down after the Doji. It is still not clear, whether it will go further downwards or reverse and the uptrend will continue. However, the thing is that the price can increase for a very long time without any pullbacks.
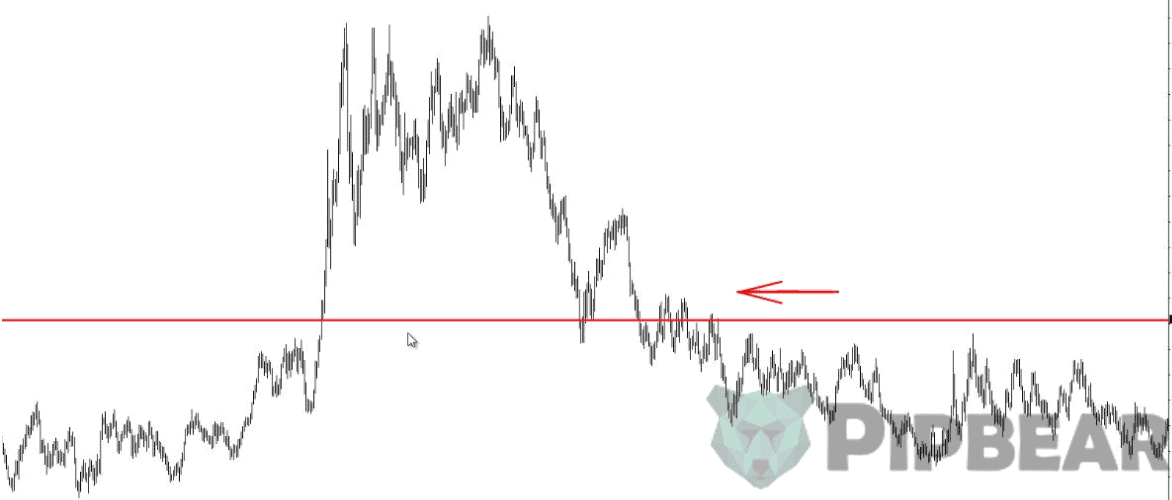
You should also distinguish between trading against a certain trend (when you trade against it and try to enter the market against the trend) and range trading. That is when there is no certain price movement upwards or downwards but you observe some zigzag movements. Look at the example below:

When you can’t see whether the bulls or the bears are dominating the market, you should set smaller goals a trade the same way you usually do. That is, you trade from level to level since nobody can predict the direction of the price movement in case of range trading. We don’t know for sure whether it will bounce from the level or break it out and form a new trend.
That is why you should set small goals while acting under uncertainty. Once you have entered into the transaction, the closest level is your goal. Trade carefully level-to-level and do not keep the position for too long.
Range trading is more dangerous than trading with the trend but it is less dangerous than trading against the trend.
What are the Attributes of a Good Setup against the Trend?
- First, a strong movement must occur before you may enter into a transaction as we have discussed in the USDCAD example above. That is, you should get a prolonged and strong downtrend/uptrend.
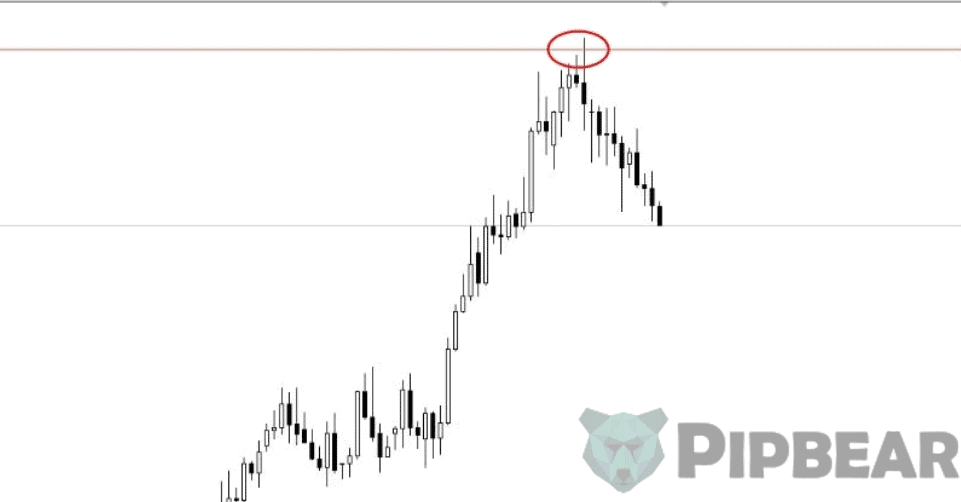
The candlesticks should be large comparing to the average ones of this timeframe and currency pair. Therefore, the candlesticks must stand out from other ones on the chart. For example, look at the candlestick below:

- Second, there must be some room to the left. What does it mean?
Imagine that you look at the price movement. You consider it a trend one and want to enter into the transaction but you also see other candlesticks to the left of it. This is very likely to be a range, not a trend movement. However, if the candlesticks are far enough from your potential entry point, then the trend is quite weak and entering the market would be irrational. In such cases, you should better refrain from entering into the transaction and wait until the trend finally reveals its further direction.
- Third, you may think about entering into the transaction if you see a double top. A previous top should be not far from the current one. Or it may be far enough though it will be not a double top but a bump into the level.
You may read the article about the Double Top pattern that we have discussed recently.
- Besides, if the price has gone far and is still up in the air having no bump to the level (that is when you pull away from the chart), then this is a new top that has not occurred yet or occurred a long time ago.
Let’s have a look at the example. I have winded off the day chart till 2009 and didn’t see this top anywhere.
This was a price for the currency pair but it never formed any extremes nearby. That’s why there is no bump to the level. Remember, if there is no bump to the level, it is insecure to enter into the transaction.
Are There Any Worth Moments to Enter the Market?
Yes, there is when the price bumps into a level. It would be good for the day traders to switch to a higher timeframe and see what is going on there. Here are the daily charts. Let’s mark our top with the level.
Imagine you are going to enter into the transaction now. Let’s switch to the weekly chart and see what kind of a level it is and what happens on the weekly charts. There are long candlesticks on the weekly charts and you see a space to the left of it, a strong uptrend and a pin bar. If you pull the chart away, what will you see? Have you ever seen a top like that before?
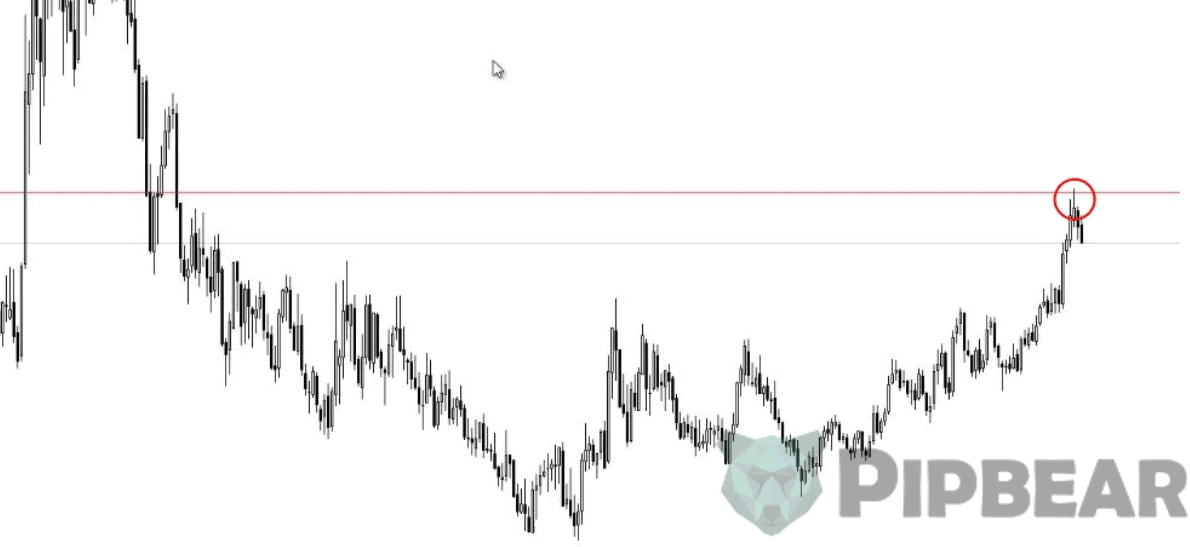
No, you have not, so the entry is insecure. Moreover, you can see no level on the weekly charts. If the marked level were on the weekly chart, then the market entry would have been more reasonable. However, you have no level on the weekly charts so you deal with what you have. Nevertheless, don’t forget to look at the higher timeframe if you have any doubts.
I have given you a few attributes of a good entry against the trend. However, the attributes are often not enough since the long candlesticks or presence of the setup, which is quite natural for entry doesn’t make us sure as the price may keep moving in the same direction.
When Do You Have the Real Chance to Enter the Market if You Feel Strong About It?
First, you should wait for the attributes I have told you about. Wait until the price gets to the high at the same level at least a couple of times. In this case, you can see it on the chart. The price bumps into almost the same level.

The selling price was 1.1121. The price should not necessarily bump right into the pip. It is good enough when the price bounces in the narrow limits (give or take three pips). When you see that people have been selling from the same point for several days, that is they don’t let the price go higher, it is a good sign to enter into the selling transaction. It is a sign that the trend has slowed down at least and the retracement will occur.
It’s all because you need a lot of assets and resources to keep the price below a certain level and sell from this level. Which means that there is a strong player on the market.
In case of a prolonged strong trend, you should wait until the price bounces from the price level at least twice and then you may enter into the transaction. It would be best to enter into the transaction near this level. And of course, you should enter using the pending order.
When Is It Best To Do So?
Now there is a candlestick bouncing from the approximate price of 1.120 pips. Soon another one bounces from the same price a couple of pips lower. Let’s set a level here. What does it mean? It means that a new level is forming, from which the traders are selling.

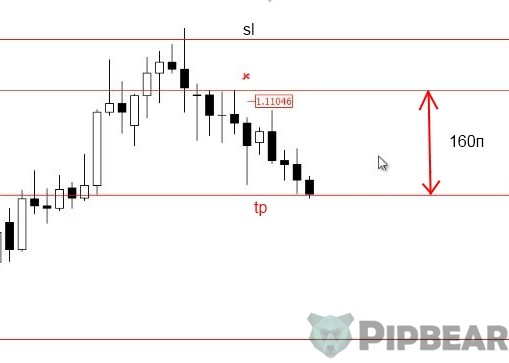
After the second candlestick has bounced with a new high and closed, you should set a pending sell limit order nearby the level. Where shall you set the pending order? The price has bounced from the level of 1.1120 so you set it on the level of 1.1105. Set the pending Sell Limit Order as the Doji closing price should be lower than the price at which you would want to enter. So the Stop Loss order must be set a bit above the level. You should set the Stop Loss order on the same distance above the level as the distance on which you have entered into the transaction below the level.
What Goal Should You Set?
If you trade against the trend, do not set any major goals. Our goal is the closest level. In this case, the closest clear level is far enough. You may keep it or get reinsured by increasing the Stop Loss order by four times. In this case, our Stop Loss order is 40-45 pips. If you multiply it by four, you will get 160 pips. However, you can see that the price has already reached this level. Our Take Profit Order would have been taken anyway at the moment. Therefore, the transaction would be closed with a four-times larger profit than the stop-loss order.
That’s how you should enter into the transaction against the trend.
If you had a level at this point, it would be a lot easier to find an entry point by the setup or the pin bar with the support level. If you can’t see the level, wait until it is formed, that is when the price bounces twice from some price mark.
These bars may not necessarily come in sequence. There may be one or two candlesticks between them. However, you should not wait for too long and if you see five bars or more, you may start looking for another setup.
If you made the buying transactions, you would be waiting for the price bouncing twice from the same price level. We would wait until two lows of the candlesticks happen to be on the same level. It would mean that a large player buys from this level. If you entered by the setup from the level against the trend, you would set the Stop Loss order by the setup rules.
A Couple of Advice for the Intraday Traders
You may enter into the transaction from the level of the previous day. You can take the low/high of the previous day candlestick as the level while trading intraday. You can watch the levels on the daily charts and take daily average range or just close the transactions at the end of the USA session (in the evening). What does it mean to take the daily average range?
It is an average size of the candlestick from the High to the Low of the certain currency pair.
That is, if an average size of the candlestick from the High to the Low is 100 pips and the price has already hone through 80 pips, you should better close the transaction since the price is not very likely to go through a few more pips.
Let’s take a look at a few other examples
That’s an interesting example. A massive collapse started on the H4 timeframe and a pinball with a long tail appeared. By the way, you also had the bearing on the level. It seems like you may enter… But if you enter here, our nearest goal (the nearest level) will be this one.

And as you can see, the price hasn’t reached it. If you had entered at that point and saw the tails when the price failed to reach the goal, it would have meant that you should have left earlier. If you see that the price hasn’t reached the goal and drawn a tail, get out of it.
Therefore, you should carefully monitor the price behavior while trading against the trend in general. If there is even the slightest sign of the continuing trend and you have entered against it, just get out of it. It’s better to get a small profit or a small loss. Always treat the entries against the trend as some kind of flammable substance.
One Profitable Entry against the Trend
Sometimes you may see a long tail on the day and intraday bars.
This is a good entry point. When the candlestick with such a long tail closes, you can enter into the transaction right away since it means that the players are actively buying or selling and there will be a down impulse. It usually always happens after such candlesticks. You may stay in such a transaction a bit longer and wait until the next level finally comes. That may bring you a very good profit.
This is some kind of a free treat from the market because everyone will enter the market at this point. Do not forget about the Stop Loss orders and set them either after the tailor near the end of the tail. It won’t work any other way as the surges still may occur when the players try to knock out those who have entered on the tail. That is ok. You have to set a large Stop Loss order but the profit might be really large as well.
Another Example of the Good Entry
Imagine a strong upsurge against the trend. You would have entered at the closing of the candlestick and then the price went down. You may wait until it reaches the nearest level or even the next level after it. Maybe, that would be even better. You could take 129 pips, which is very good on the H4 timeframe.
If you see any other large tails, it is a good signal to enter the market even against the trend.
Let’s take a closer look at the example for the buying transaction. On this chart, you can see a strong trend moving down and then stuck. As soon as you see that the price has stuck, get ready. Now, the price has bounced three times from one level. You might set a pending Buy Limit order after this Doji practically at the price of this one Low of the candlestick, then at the Low of this small one and the one coming after it. You could even enter the market at this Doji. The Stop Loss order is just below the level at approximately the same distance as the pending order.

As you can see, the price has made a false breakout and gone slightly beyond this price limit. However, it hasn’t reached the Stop Loss order and the price went upwards again. You could have waited for the nearest level to come. You also could have got out of it late and get a profit. You could have waited even longer but it is quite insecure to keep moving against the trend for too long.
Probably I would have left at this level. It depends on the way you have marked it since there would be a Take Profit order a couple of pips below that level and no Take Profit orders a couple of pips above it. If there were no Take Profit orders, I would have left right at this candle since the long tail states a danger to the position in this case. I would have gotten a 30 pips profit. These are the 4-hours charts and the Stop Loss orders were only of 10 pips.
That is, even if you had closed after this tailed candlestick without taking a Take Profit order, you would have gotten a profit that is three times bigger than the Stop Loss order. If you had taken the Stop Loss order, you would have gotten a profit that is 7 times bigger than the Stop Loss order.
To sum up, I would like to say that you can trade against the trend but do it extremely carefully. If you are a budding trader, I would not advise you to open the transactions against the trend at all (well, except for the heavily “tailed” candlesticks). This is the only exception, which can be used by the beginners. However, do remember about mindfulness even in this case.
I should remind you to watch over the price vigilantly while trading against the trend. If you even think you have noticed the slightest hint that the price may reverse, leave right away.


I always try new strategies on a demo account
Having diversity in terms of trading strategies is key in successful forex trading.
That was quite a piece.
good insight acquired!
But the risk still remains higher