

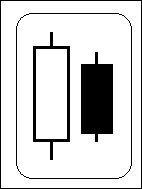
Inside bar is a candlestick which formed within the range of the previous candle (often referred to as “the mother bar”), i.e. its high is lower than the previous bar’s high and it is low is higher than the previous bar’s low.
Before reading the article and writing your questions in the comments section, I recommend to watch this video. It’s not long but covers the biggest part of questions on the topic.
An inside bar is an indication of market uncertainty and consolidation. Common in trending markets, an inside bar signals the continuation of a trend after the mother bar breakout. Inside bars can occur at the top/bottom of a trend, key support/resistance levels, and sideways channels.
Inside bars are used as low-risk entry and exit points.
Trading an inside bar breakout within a strong trend is a surefire way to make money. In this case, a stop-loss order should be placed below the middle part of the mother bar or above/below the mother bar.
- Inside bars are a great tool to trade trends in D1 charts. Furthermore, they can be used to identify trend reversals and countertrend entry points.
- An inside bar signals that the market is slowing down before making a strong move.
Here are the examples of inside bars in a daily chart:
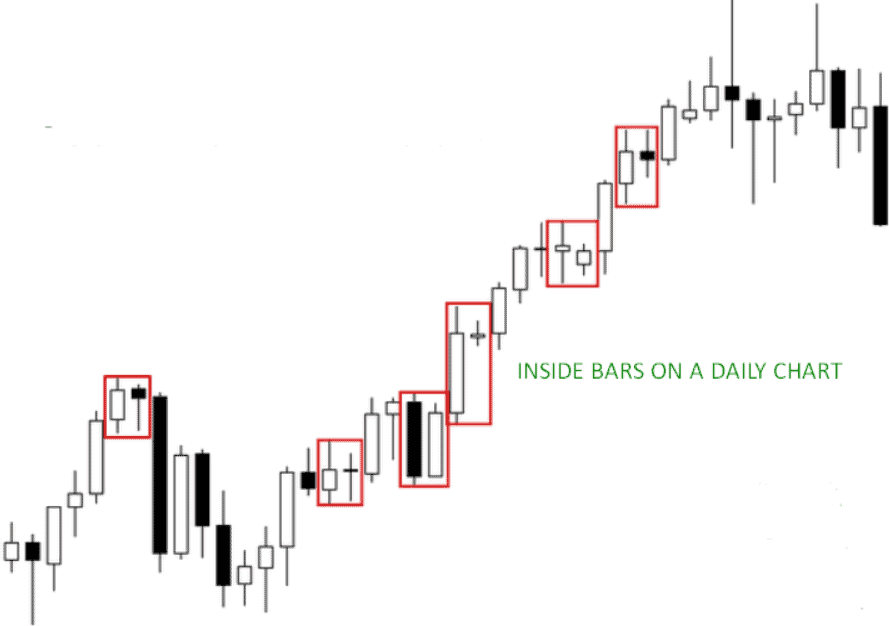
Table of Contents
About inside bars
As mentioned earlier, an inside bar forms within the range of the mother bar. While some traders measure the range between the high and low of the mother bar, others take into account its wicks as well. Anyway, this is not important. An inside bar can occur at the top, in the middle or at the bottom of the previous bar.
It’s not uncommon that the two bars have equal lows but the high of the mother bar is higher than the high of the inside bar. If the two bars have equal highs, the mother bar must have a lower low. If, however, the candles have equal high and lows, this is not an inside bar formation.
In the image below, you can see common inside bar patterns. The mother bar can be followed by one or several inside bars. The second drawing shows a mother bear and two inside bars, with each new bar fitting within the range of the previous bar. This setup is also referred to as a spiral inside the bar. The longer the formation, the stronger its breakout will be.

Important: An inside bar is, in fact, a breakout setup. When price breaks out above or below the mother candle, it’s a great entry opportunity.
When going long, you need to place a buy stop order slightly above the mother bar. When going short, you need to place a sell stop order slightly below the mother bar. If there is a strong trend, you can make an entry earlier, without waiting for a price to break the mother bar. A word of caution: novice traders should stay away from using this advanced technique and follow the standard entry rules.

Best techniques for trading inside bars
Let’s break down how to trade an inside bar breakout within a trending market on a daily chart. This is one of the easiest methods to trade inside bars.
The lower the timeframe, the more inside bars appear on your chart. This is why trading inside bars on low timeframes is very challenging and risky, especially for beginners. I never trade inside bars on timeframes lower than 4H because they’re full of false breakouts and stop-loss activations. Almost 90% of the time, I prefer to trade inside bar setups in D1 charts and recommend that you do the same.
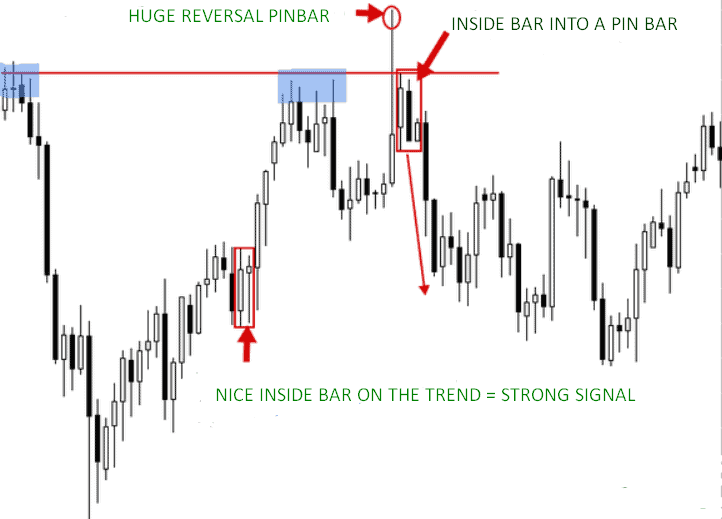
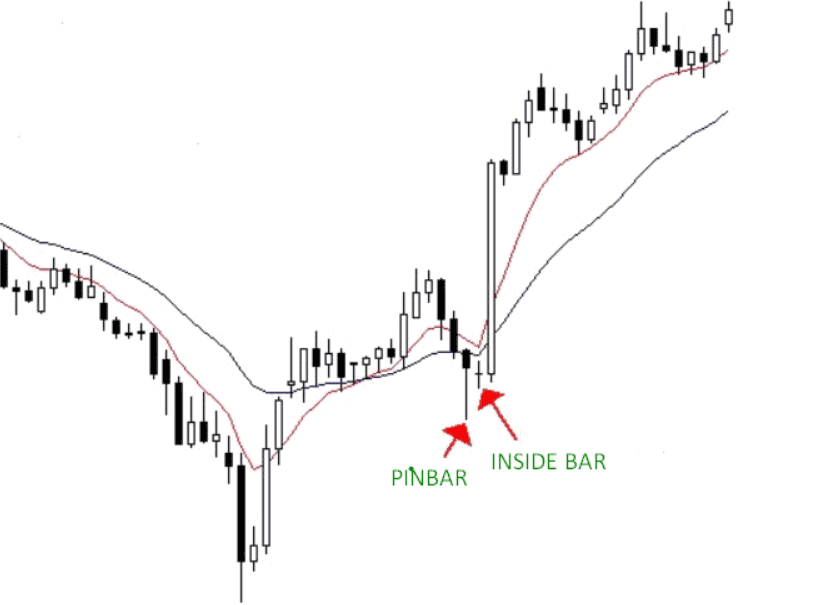
In the D1 chart below, you can see some beautifully formed inside bars. Pay special attention to a combination consisting of an inside bar and a pin bar. This pattern is traded like a regular inside bar, i.e. when a price breaks out above or below the mother bar. A pin bar makes the setup more reliable. If there is an uptrend, a bullish pin bar indicates an upcoming breakout upwards. If there is a downtrend, a bearish pin bar signals that a price is going to break out downwards.
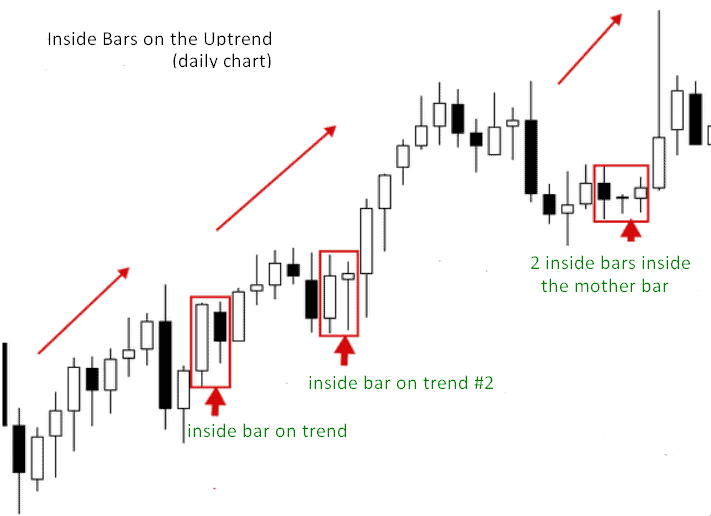
The last formation in the chart consists of a mother bear and two inside bars. It’s a pretty common pattern that offers good trading opportunities. Honestly speaking, I’m not a fan of setup consisting of more than 4 candles. Ideally, there must be a mother and two inside bars followed by a breakout.
As you may already know, setups around the top/bottom of a trend are very unreliable. With that said, before looking for price action signals, you should wait till a price pulls back to a support/resistance level.
If a price is trending and moving along EMA 8/21, inside bars, which formed on EMA 8 after a slight pullback, work great in D1 charts. While inside bars are usually easy to deal with, you’ll have to trade hundreds of them until you can develop an intuitive feeling about these setups. It won’t happen in a day, so be patient.

Inside bars in a trending market: Consolidation & Breakout
After moving within a trend for some time, a price “takes a rest” and starts going sideways before the next big move. This is where inside bars come in. Inside bars usually occur before a price breaks out of a consolidation zone and continues trending. In the chart below, an inside bar formed after a 5-day consolidation period. You need to enter the market at the breakout of the mother bar. By placing a stop loss at the 50% level of the mother bar, you can easily get a 1:2 risk/reward ratio.

Spiral inside bar
A spiral setup consists of two or more inside bars, with the previous bar acting as a mother bar to the next one. Each new bar is smaller than the previous one.
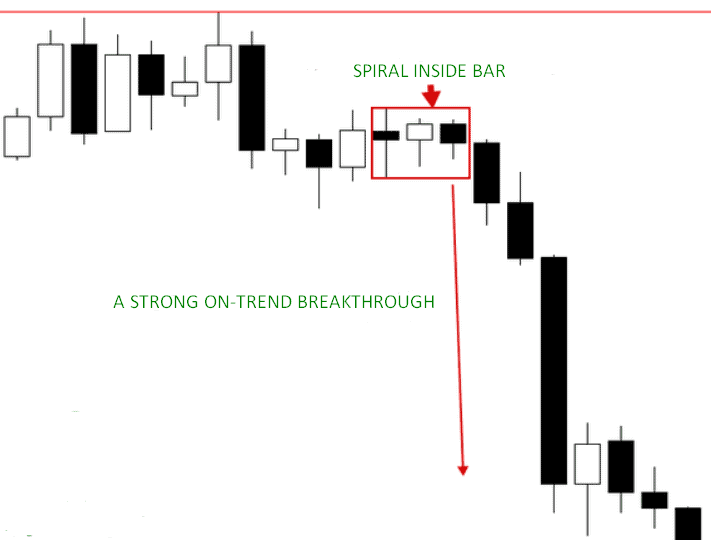
Let’s take a look at the chart below. As you can see, there is a mother bear and two inside bars. The second inside bar formed within the range of the first inside bar. If you see a small setup like this one, you can make an entry once a price breaks out above or below the mother bar. If the main mother bar is large, you can enter at the breakout of one of the inside bars, although this is an advanced technique.
The main thing to remember about spiral inside bars is that they rarely end up in strong breakouts since they indicate a consolidation period. A price moves inside a narrow range before making a big leap, especially in a trending market.
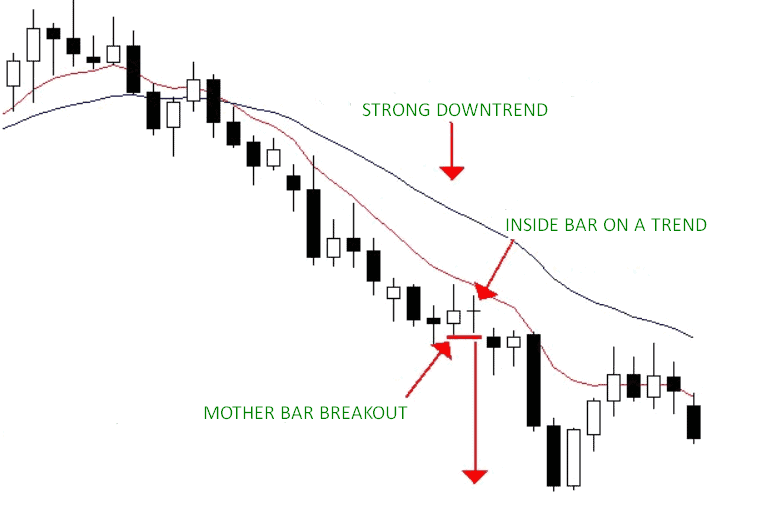
In the gold chart below, a spiral inside bar predicted the continuation of a downtrend after the mother bar breakout.
Inside bars at support/resistance levels as a reversal signal
Inside bars at support and resistance levels act as reversal signals. Keep in mind that such bars are trickier to trade. You should only explore this technique after you’ve mastered how to trade inside bars within a trend (see above).
Since inside bars at support/resistance levels can predict a strong price move or even trend reversal, it’s worth taking a closer look at them.
In the chart below, you can see an inside bar that formed slightly above the support level. We’re looking at a strong support level that caused large price moves earlier. You can see that a price retested the support level and formed a bullish pin bar. Three days later, the pin bar was followed by an inside bar. The inside bar indicates a consolidation zone slightly above the support level, giving the green light to make an entry. A stop loss is placed below the mother bar.

Inside bar and false support/resistance level breakouts
When an inside bar occurs at a support/resistance level, it’s often accompanied by false signals preceding a trend reversal.
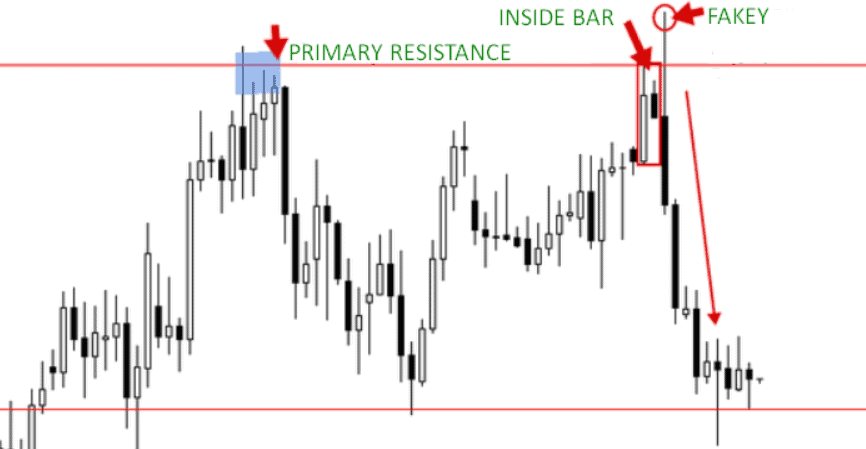
In the chart below, you can see an inside bar that occurred at the key resistance level. A price attempted to break out the inside bar upwards but then the bears took control of things, causing a price to pull back. Then a price formed a large inside bar with an impressive false breakout.
Be careful when dealing with inside bars that formed at the key support/resistance levels on daily charts. Prepare to face an abundance of fake signals and false breakouts. Remember that false breakouts often indicate that a trend is about to change its direction.
Inside bar and pin bar
An inside bar may follow a pin bar, especially the one with a long wick (see the chart below). Such an inside bar adds validity to a pin bar. A stop loss is placed above or below the mother bar.
General information on trading inside bars
I prefer to trade inside bars in the daily charts. You should avoid 4H and 1H charts unless you want to deal with endless false breakouts. If you’re adamant about trading inside bars in a 4H chart, be sure to confirm a trend in a D1 chart.
I’m often asked about the color of the mother bar. In other words, does it matter whether an inside bar or its mother bar closes in the direction of a trade? The answer is “no.” If an inside bar is properly formed and is in line with a daily chart, everything is OK.
Remember that an inside bar and a fakey (inside bar false-break pattern) are two different setups. While telling the difference between them is quite tricky, you’ll learn to do so as you gain more experience in trading inside bars.
Another question I’m constantly asked is how to avoid an inside bar turning into a fakey. The answer lies on the surface: don’t trade inside bars against the trend. Beginning traders should trade inside bars within a trend in daily charts. This is the rule that will protect you from disappointing losses.
Case studies
There are two key methods to trade inside bars:
- Within a strong trend after a price pulled back to its average value. In this case, an inside bar indicates trend continuation;
- At support/resistance breakout in a trending market. Here again, an inside bar signals that the trend is going to continue.
In the GBP/USD chart below, you can see an inside bar that formed within a strong downtrend, near EMA8. The inside bar has a perfect structure and offers great entry opportunities:
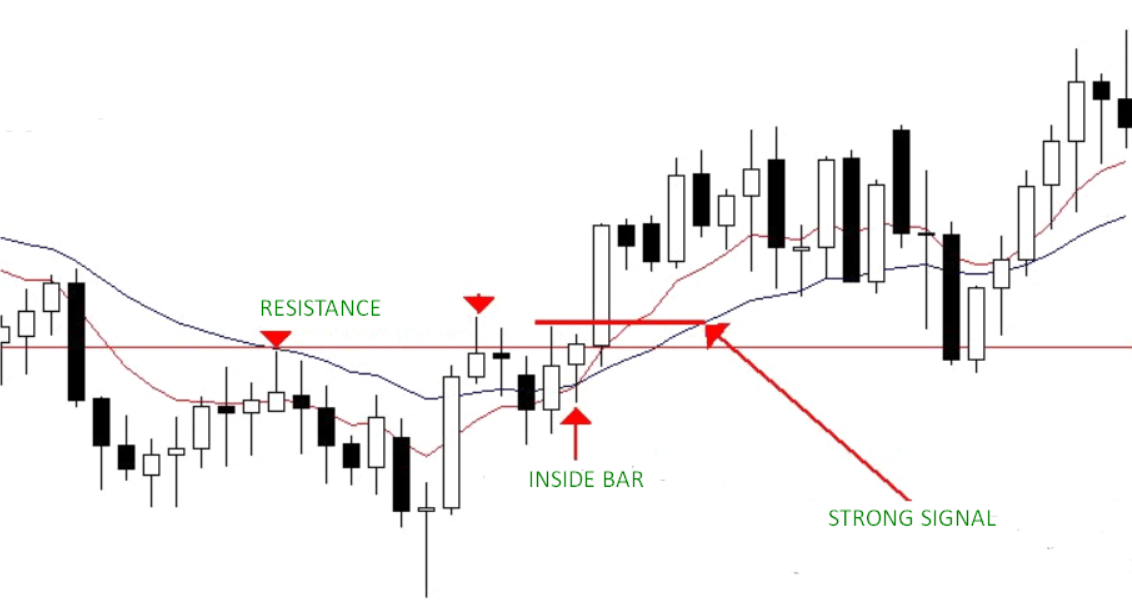
Here is another example of an inside pin bar (inside bar + pin bar) in the GBP/USD chart (see below). The inside bar occurred slightly below the resistance level, preceding its breakout. After a price crossed EMA 8/21, a new trend started to steam up following the formation of an inside bar. The breakout of a mother bar indicated that the price would continue to go up, which is exactly what happened.
Inside bar following a pin bar
In this formation, a pin bar is followed by an inside bar that formed within its range. This powerful setup offers lucrative money-making opportunities in trending markets. It indicates that a trend is weakening and a reversal is coming. Take a look at this daily USD/CHF chart:
Inside bars can be used as reversal signals but …
As mentioned earlier, you should only trade inside bars against the trend after you’ve got the hang of how to trade them within the trend. Abstaining from countertrend trading is the easiest way to avoid fake patterns.
The only inside bars that can be traded against the trend are those that formed a strong support/resistance levels. This is something experienced traders may try from time to time.
Entry points and stop-loss
The best way to trade an inside bar is when a price breaks the mother bar above or below. To ensure a better risk/reward ratio, you can place a stop-loss order at the 50% level of the mother bar. Alternatively, you can place a stop loss above/below the mother bar. However, to keep risks at bay, you should reduce the size of your lot and increase your stop loss.
A spiral inside bar is another high-profit trading setup. It includes several inside bars, with each new bar engulfed by the previous candle. This formation represents a consolidation period before a large move, especially in daily charts. The tighter the consolidation, the stronger the upcoming breakout will be.
There is no denying that an inside bar is a profitable setup that can generate consistent profits. If traded properly, inside bar setups can be a great addition to your trading toolbox.


