

Knowing how to use charts to assess the market situation is of crucial importance. Nowadays, the ability to interpret charts is essential to successful Forex trading. Japanese candles are the most popular type of Forex formations. Along with Japanese candles, traders also use linear charts and bar charts.
Before reading the article and writing your questions in the comments section, I recommend to watch this video. It’s not long but covers the biggest part of questions on the topic.
At the same time, there are Renko charts. Although not as popular, they are a powerful trading tool. In this article, we’ll find out how to use the benefits of Renko charts in your trading.
Table of Contents
What is a Renko chart?
A Renko chart is a visualization of how the price of an underlying asset is moving. The chart consists of same-size blocks. These can be bullish or bearish blocks in a standard bar or candle pattern.
You may wonder why blocks in a Renko chart have the same size. It’s because a Renko chart doesn’t consider time. A Renko chart has a parameter that determines the number of pips in each block. In the MetaTrader platform, this parameter is set at 10.
This value means that the next block won’t be built until the price increases or decreases by at least 10 pips.
With that said, each new block in the Renko chart may take an indefinite time to form. The next block may occur within a second, minute, hour, day, week or longer. You never know for sure! The only thing you know is that the size of a block is 10 pips (or any other value you choose).
This is how a Renko chart looks like.

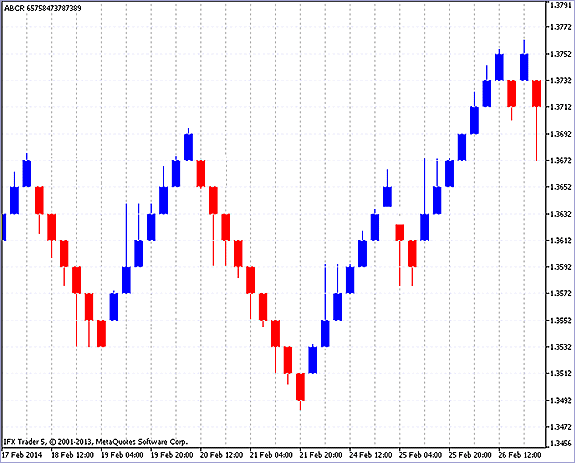
Now take a look at a standard chart with Japanese candles.

Both charts display the same price movement but in two different ways.
As you can see from this example, Renko charts tend to smooth out price action.
Types of Renko charts
Based on the calculation method used, the Renko charts come in two major types.
High/Low Renko chart
A High/Low Renko chart displays every price movement. As its name suggests, this type of chart displays price action between the highest and the lowest points on the chart.
Open/Close Renko chart
Open/Close Renko chart only displays price action between the opening and closing prices. Sometimes, a Renko chart may look like this:
From the chart, you can see that some bars have long shadows, just like in Japanese candles. Why? Because the chart only shows the opening and closing prices. In other words, some Renko charts don’t include price action, and ticks outside Renko blocks are displayed in the form of shadows.
Let’s open a Renko chart in MetaTrader
For a novice trader, opening a Renko chart in MT may be a challenge. Let’s break it down step by step. You first need to upload an MQL4 Renko file. Then you need to place the file in the “Expert” folder. How do you do that? In MT4, open “File.” Select “Open Data Folder” and go to “MQL4” -> “Expert.” This is where you need to place the file. Then restart МТ4.
After restarting the trading platform, look at the navigation panel on the left and find the Renko file.
Before adding the file to the trading platform, click on “Expert Advisor” or “Auto Trading.” Now you can drag and drop the Renko file from the navigation panel to the chart.
Now you’ll see Renko blocks on your chart. Go to “Service” –> “Settings” –> “Advisors” and check the following options:
- Allow automated trading
- Allow DLL imports
- Allow WebRequest for listed URL
Click on “ОК” to save changes. Now look for a message and a smiling face in the upper right corner of the chart. This means that the settings have been activated. In the upper right corner, you’ll see a message urging you to open the chart autonomously to activate the tool.
Select “File” -> “Open autonomously”. You’ll see a pop-up window with different variations of an autonomous chart. Choose the right timeframe. That’s it! Now you have a Renko chart open in MT4.
Advantages
If you’re a fan of Renko charts, you must know that it’s a great tool to analyze price movement. Let’s zoom in on the benefits of Renko charts for MT4 traders.
Identify trends
A Renko chart can identify the direction in which the market is moving. As a Renko chart smooths out price action, a trader gets a clear picture of what’s going on in the market.

In the chart above, you can see that the price is fluctuating. There are no consolidation periods. There are both minor and big price movements but no overlapping ranges.
Perfect for support/resistance trading
Renko charts are good at identifying support and resistance levels. As each block in a Renko chart consists of a certain number of pips, it can display support and resistance levels with a high degree of accuracy.
On the chart below, you can see two support levels and two resistance levels. Note that the price retests each of the four levels, starting to move in a new direction.
The red circles show us where Renko bars broke the levels. Each breakout is followed by a new uptrend or a new downtrend.
Breakout confirmation on Renko charts
Renko charts are mostly used to gain a clear understanding of the market situation. This is the main purpose of this tool.
Trading breakouts is one of the most popular ways to use Renko charts. Most traders use charts to confirm breakouts. Wait for the second candle to confirm the breakout. If a Renko candle breaks the trend line, look for another candle that would go beyond the broken candle.
Renko breakout strategy
As I’ve already mentioned, identifying trend breakouts is one of the best trading methods. Unfortunately, a trend line on the Renko chart is not completely accurate. To confirm a trend reversal, you need to wait for the second Renko bar.
The first Renko bar must break the trend line, and the second Renko bar must break out of the first one. Then you need to place your stop loss after the last high or low that formed before the breakout.
Getting hints from price action, you can hold your position until the market starts to move against you.
Support/resistance strategy
According to this Renko strategy, you need to open a position after the breakout of a significant support or resistance level. If the level is broken downwards, you should go short. And again, remember to wait for the second Renko bar as confirmation.
If you’re trading a support level breakout, you need to place your stop loss above the line where you’re expecting a breakout to occur. If you’re trading a resistance level breakout, you need to place your stop loss below the resistance level where a breakout must occur.
This approach ensures an easy and intuitive trading.
Wrapping it up
Let’s sum up some major information about Renko charts:
- In a Renko chart, time is not a factor;
- A Renko chart consists of blocks, which are also called “bricks” and “candles”;
- By default, each block includes 10 pips (up or down). You can change this parameter if you want to;
- Trend breakouts need confirmation. You need to wait for the second Renko bar to close outside the breakout bar.


I Am ONE GREAT USER OF RENKO CHARTS..
This is one outstanding tool of analysis
My expert advisor cant work well without renko
I have traded gold now for long using renko…it’s the best tool for gold traders
renkos obey resistance and support lines quite pretty and great pullbacks happen
My teacher must see this post as well Dr Dhiram… my great renko mentor
I thought they would work perfect on a vps hosted interface
am Renko..who stole my name and gave it to forex tools ?