

In this lesson, we continue our study of the price action approach and move straight into the candlestick analysis aspects. Anyone who has already been through the lesson on the trading platform adjustment and conducted at least several transactions (real or demo) on the forex market, should know enough about Japanese candlesticks. I don’t intend to stuff your head with various facts and the names of the patterns’ authors. Let’s discuss how to use the candlestick configuration to improve your trading performance.
When we adjusted the trading platform, I told you that I find it more convenient to use a standard black & white color set in the chart window. I will use the black & white color set in this lesson too but don’t forget that in other sources on candlestick analysis, you may find other colors used. The green & red color set is a very popular one. The bullish candlestick comes in green, while the bearish one comes in red.
Table of Contents
What Data Does the Candlestick Display?
Each candlestick contains data, which you call see textually by hovering the mouse pointer over the candlestick.
- Open – opening price.
- Close – closing price.
- High – maximum price level over the period.
- Low – minimum price level over the period.
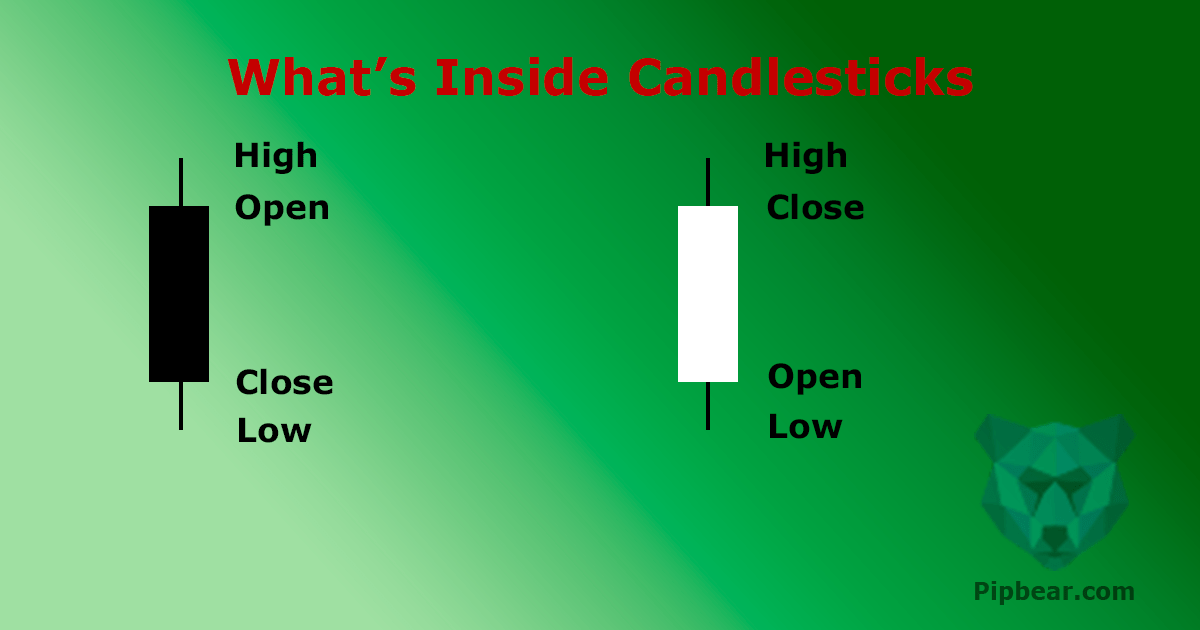
The candlestick becomes black when the close level is lower than the open level. The candlestick becomes white when the close level is higher than the open level.
Formations and ratio between the open, close, high and low levels create the candlestick patterns, which is the bedrock of the namesake type of technical analysis.
Each formation has a sophisticated name and traders seem to introduce new names hourly. Therefore, I don’t see the need to learn the names by heart.
You can try to explain each gap in the context of the interaction between the bulls and the bears. However, I recommend that you just make an analysis of the chart in the strategy tester mode and figure out which patterns would bring you a profit.
Gaps and Their Closing
Before we talk about the candlestick formations, we should deal with the term “gap.”
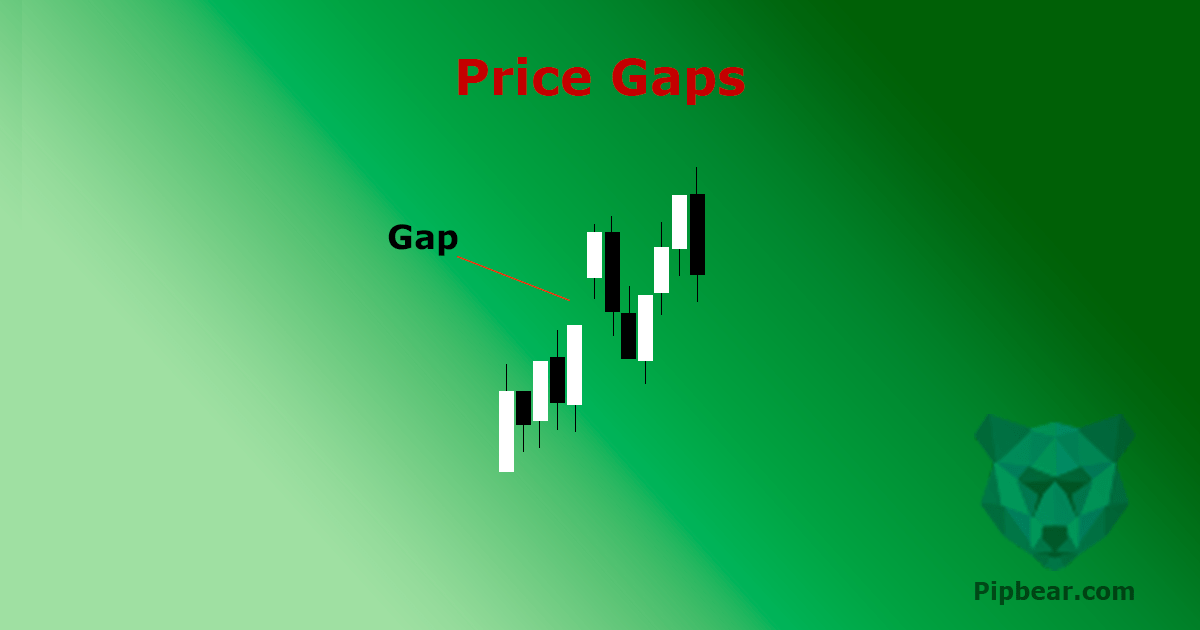
A gap is the difference between the closing quotes of the previous candlestick and opening quotes the new one. Price quotes on the Monday mornings is the easiest example of such gaps. Depending on the events that took place on the weekend when the markets are closed, the Mondays tend to start with an up or down gap. The gap size directly depends on the importance of the events.
The gaps occur all the time. Right now, you can open a one-minute chart and compare the opening and the closing prices over the last couple of hours. I am sure you will find some price gaps within this period.
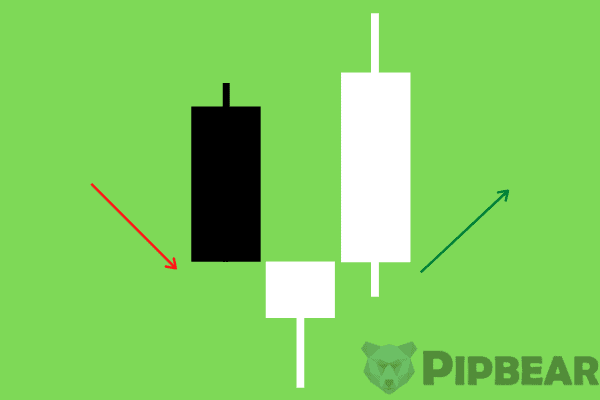
The closing gap in the context of chart analysis is the strongest signal to open the position.
A closing gap looks like this on the chart:
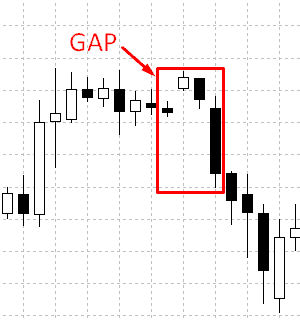
The second candlestick closed on a higher level than the previous one and then the price has made up the gap and closed lower than the close level of the previous hour. This is a strong signal to make open a short position and such candlestick configuration has its name. We will talk about these and other formations later on.
Types of Candlesticks You May See on the Charts
Let’s take a look at several candlestick formations that we most often see while trading. Most data on candlestick analysis is about bullish formations.
The bullish formations are also called the reversal formations.
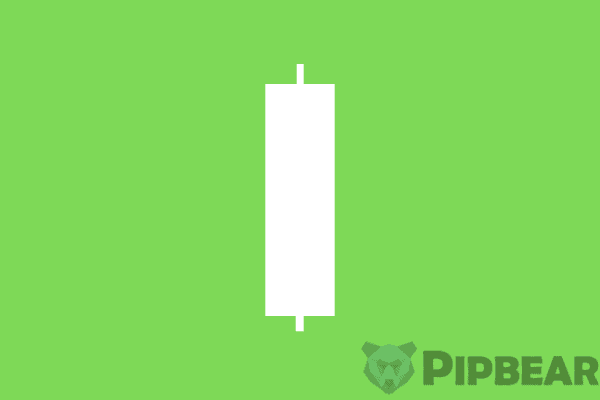
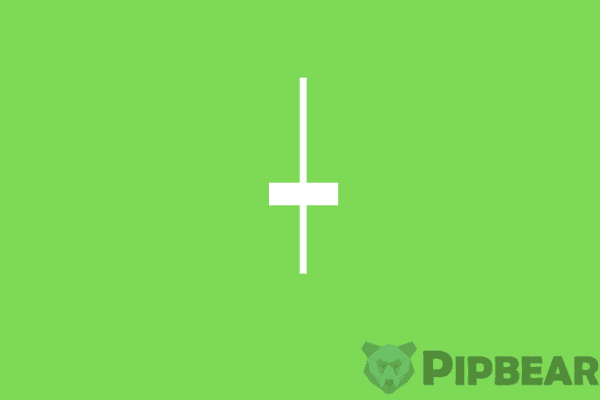
- The big candlestick body and the short shadow can be treated as the dominancy of the buyers over the sellers (and vice versa). You can describe the market as directional and trending.
- The small candlestick body and the long shadow can be treated as a base, which stands for the struggle between the sellers and the buyers. You can describe the market as a flat one. Moreover, if there is a long shadow on both sides of the candlestick body, the traders see some uncertainty about the market.
- The long shadow on one side of the candlestick body and the near-zero shadow on the other side of it may be treated as the failed attempt of bulls to move the price and the following dominancy of the sellers getting short positions.
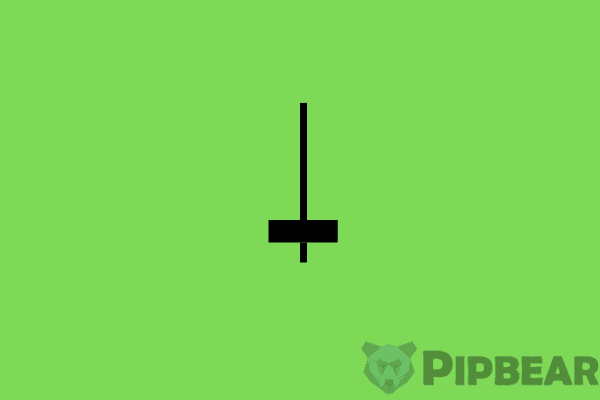
- The big candlestick body and the long shadow is the most reliable option among the scenarios with long shadow on one side of the small body. In the case of the big candlestick body, the movement has already begun in the current period.

- The small candlestick body and the short shadow stand for a small trading activity of the market. You can see this scenario as the sellers and the buyers of the instrument acting half-heartedly. For instance, this is a common cause for the EUR/USD pair during the Asian trading session.
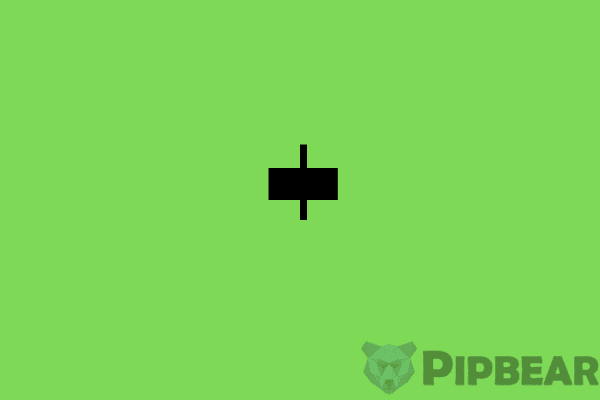
If you see this pattern during normal work hours, you should carefully think about whether it is worthy to work with this trading instrument.
Seven Most Popular Forex Candlestick Patterns
I think you understand that many patterns are described in the classic “Japanese Candlestick Charting Techniques” by Steve Nison. I believe we should pay attention to the five most common patterns you can see on the Forex market and which can be explained in the context of the interaction between the sellers and the buyers.
- The Engulfing pattern (reversal model).
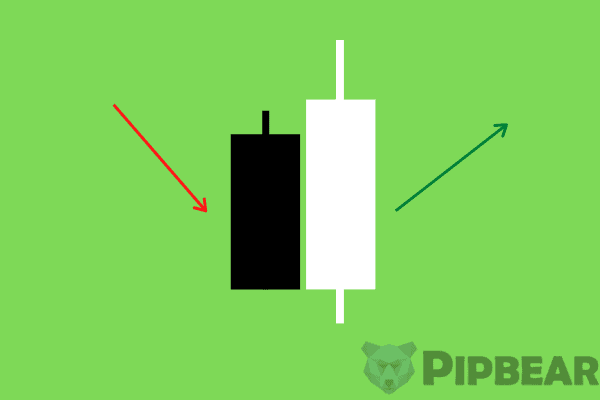
This pattern is a combination of two candlesticks that move in the opposite direction. The white candlestick completely absorbs the black one in case of the Bullish Engulfing.
- The Hammer pattern (reversal model).
This pattern is based on the long shadow and big body of the candlestick, which we have discussed in the previous section. It is called the Hammer pattern. The bullish formation would mean the white hammer coming after the black candlestick. Usually the stop-loss orders are set below the minimum level (beyond the shadow).
- The Harami pattern (reversal model), which I do not recommend my readers to use.
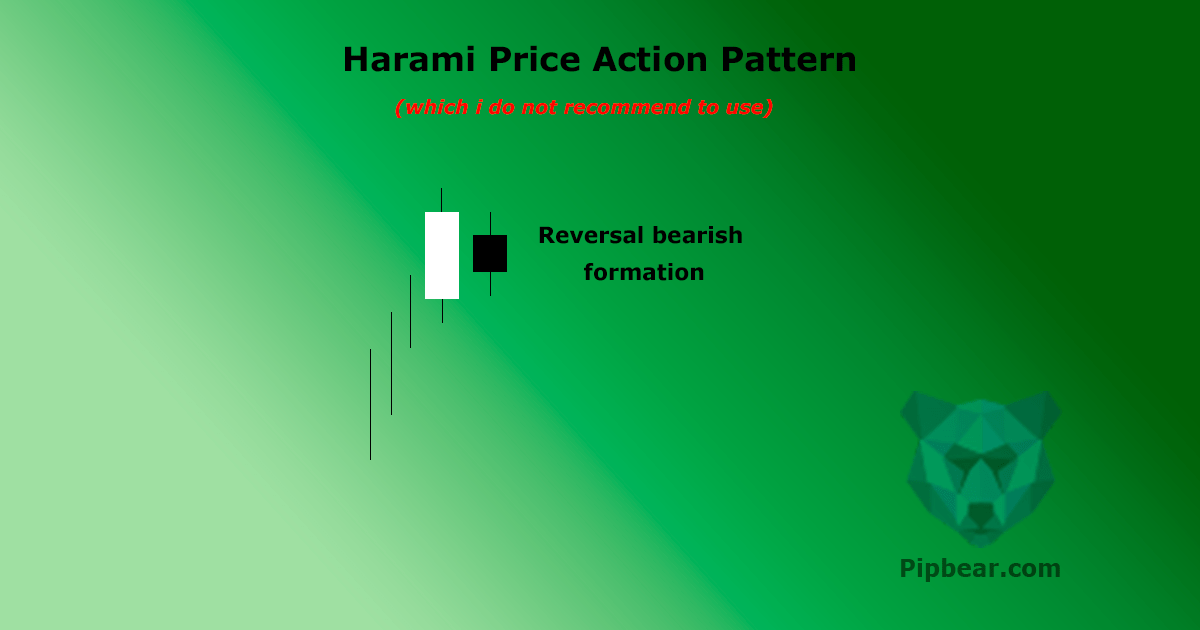
This pattern consists of the white candlestick that doesn’t go beyond the limits of the black one. I should add that the shadow of the white candlestick cannot go beyond the limits of the previous candlestick body by rules. Moreover, the second candlestick should open with a gap concerning the first one.
The Harami cross is a version of the pattern with the second candlestick having the same opening and closing prices.

I don’t recommend that you use this model for a couple of reasons.
This model is too widely spread on the market and, I failed to find a clear correlation after performing tests. However, I hope you will still conduct your tests. I cannot explain the sense of the Harami pattern in the context of the interaction between the sellers and the buyers.
Do you think you can? Then leave a comment!
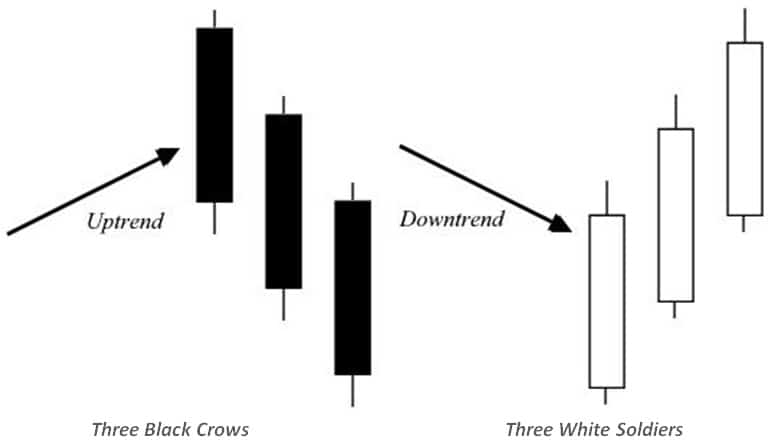
- Three white soldiers and Three black crows are the patterns I also do not recommend you to use.
The three white soldiers pattern consists of three white candlesticks with short shadows. You should realize that this formation implies a further rise in price.
The three black crows pattern is the opposite pattern to the previous one. It consists of three black candlesticks with short shadows and implies further price fall.
I do not recommend you to use these patterns for three reasons:
Several candlesticks of the same color mean that the trend has already begun and you are trying to jump onto the leaving train.
Any oscillator will tell you that the price has already been overbought (or oversold). In general, this approach is adverse to the “buy low, sell high” concept.
The only exception is when you are trading big timeframes (D1 or bigger) and looking for the smaller entries (h1 or smaller). Then the entry on this pattern would correspond to your risk management strategy.
It’s difficult to understand where to set the stop-loss order. It is logical enough to set the stop-loss order beyond the pattern’s limits, that is, beyond the opening price of the first candlestick. Then the stop-loss order size will correspond to the size of three candlesticks, which is quite a lot. Most traders would say that this approach contradicts their risk management strategies.
- The Dark Cloud Pattern (reversal model).
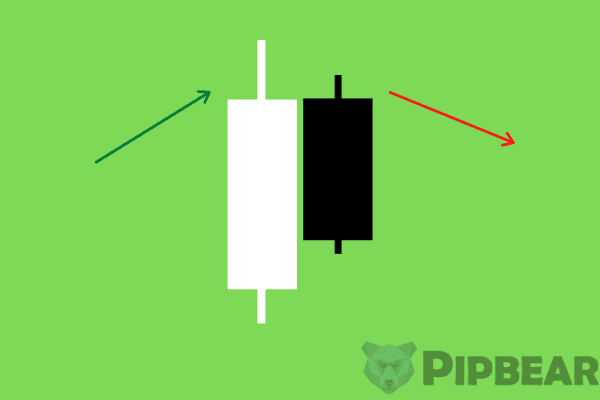
This formation is a particular case of covering. When I was spending a lot of time on candlestick analysis, the traders were determining the covering in percentage terms. Some traders considered 50% of the candlestick’s body size as the covering, the others would need 60%, etc. It means that if the size of the white candlestick is 50% or 60% of the size of the black one, the trend will most likely reverse its movement.
- Three stars / Tri-Star (reversal model).
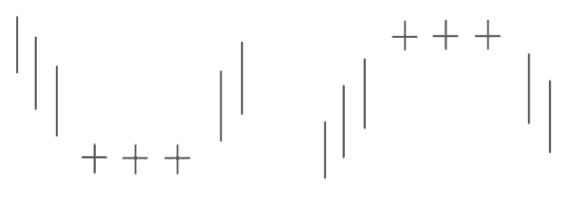
It’s a remarkable pattern since you don’t see it often on the active market. This reversal model consists of three cross-shaped candlesticks, that is, the candlesticks with the opening price equal to the closing price. Additionally, every new candlestick opened with a gap. In the case of the bullish model, the opening price of the second candlestick is lower than the opening price of the first one, and the opening price of the third candlestick is higher than the second one’s.
As I have said, these candlesticks represent luck in the market activity. We have determined the reverse of the market because of the gaps. I think it’s a worthy thing for you to remember because these gaps are a good signal even for those who do not focus on the candlestick formations.
- Morning star and Evening star (reversal models) are the patterns I do not recommend that you use.
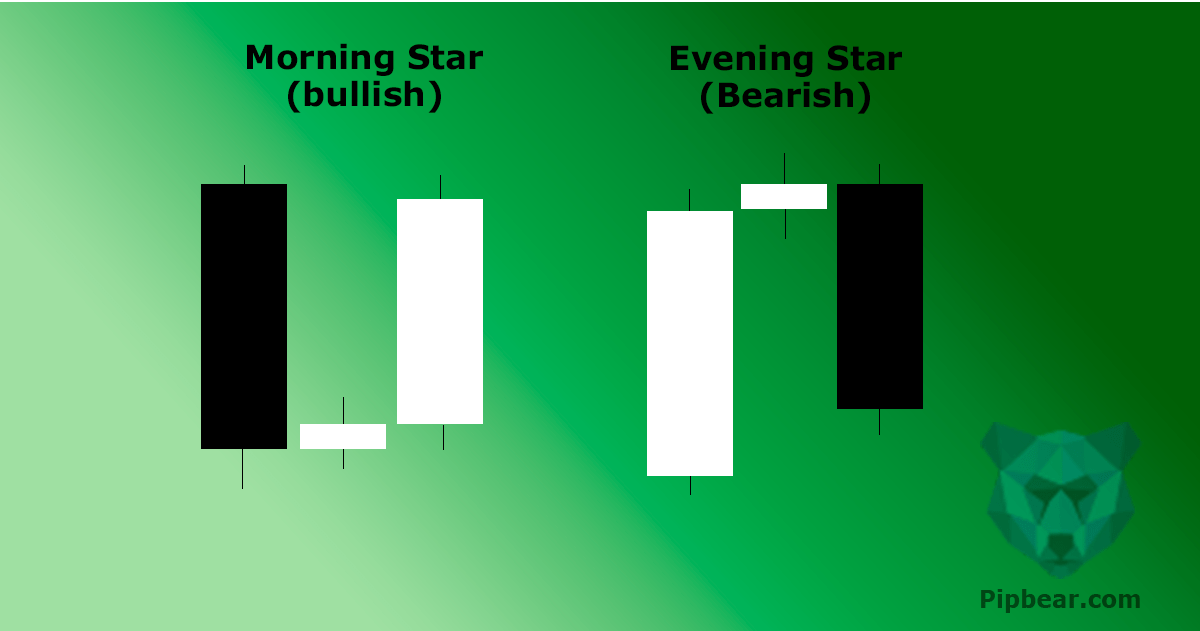
The whole situation just looks great. However, it is completely unclear how to trade in the real market conditions.
It is a widely spread case when a big white candlestick is followed by a small one. You can hardly say that this formation is a reversal pattern. The key point of the pattern is that each new candlestick opens with a gap. The second candlestick opens with a gap higher than the first ones, and the third candlestick opens with the gap lower than the second one’s. I have rarely seen this formation in the real market conditions.
Practical Conclusions on the Candlestick Models and My Recommendations
As I have mentioned before, I am quite skeptical about candlestick analysis and I don’t use these patterns in my trading. However, I think we should make three important conclusions which are:
- Similar to any other elements of technical analysis, including the indicators, the bigger the timeframe is, the more reliable the model is.
- A gap and closing the gap are signals to open a position.
- Covering may be used as a tool to determine the market’s direction on the big timeframes. In the case of the smaller ones, you should use other methods of analysis to open positions.
Homework for the Lesson
If you want to strengthen your knowledge, please do a small homework:
Find 10 examples of each of seven patterns on the chart and calculate the amount of trades, in percentage terms, that would bring you a profit.
If you find some ideas of the lesson too complicated or if you have any questions, please feel free to leave a comment! If you don’t have any questions, it’s time to go to the next lesson, which will be devoted to the trading indicators.
Sincerely,
Pipbear


Hi, About the gaps, if I left my trades over the weekend having set the stop losses. And then Monday morning,
the market opens with a gap against me. And the opening price Monday morning was past my stop loss, what will happen? will my stop loss be valid? Please expound on a scenario like this.
Pipbear, am simply laying some emphasis on the use of candlesticks because if you ask me, the pin-bar is the most important price action setup. Whenever I make use of a pin-bar I always make sure three conditions are met
1. the long shadow as in this article
2. It falls on key support and resistant levels
3. it appears on longer time frames
If I don’t use the candlesticks, can I see the same setups discussed here?
I feel knowing these setups is the starting point of any serious technical trader. Being able to identify the setups and making use of them is the basis of everything.
Pipbear, Sorry to disagree with you. I am a technical trader but I don’t believe in the power of these candlestick set ups. I would prefer to work with lines of support and resistance only. In my opinion they are hardly obeyed. EMA and SMA combined with lines of resistance and support work magic for me.
Great article Pipbear!!! Can’t agree more.
I find this a little confusing, are there tools to help identify these patterns. I think it is quite hard to cram all this shapes and patterns? I believe an algorithm could identify and trade for me?
Is it possible to have conflicting signals? for example, a bearish morning star in H1 and
a bullish morning star in H4, in such a scenario, what is the right course of actions. Thanks.
And do you have videos for this?