

In the previous lessons, it was not necessary to install MetaTrader. From now on, anyone who wants to continue with these lessons must have an MT4 or MT5 terminal on their computer and to have set up at least a demo account. I will remind you that all the tasks of this course can be performed on the demo account. It is not necessary to open a real account and invest real money at this stage.
The MetaTrader 4 Trading Platform is a universal tool for working in the forex market. The program’s functions allow you to analyze the market using a wide range of built-in indicators and oscillators; to conduct trades by opening, controlling, and closing the trade orders; to monitor the news with the built-in news feed, and much, much more. Also, MT4 allows you to download custom solutions, including analytics tools, advisers and trading robots which make the platform’s possibilities virtually limitless.

In the very first lesson of the course, I stated that, for me, MetaTrader is one of the biggest advantages of the forex market in general. I arrived at this conclusion after trading in the stock and futures markets for some time, where I had to work with platforms like Quik. After working with it, MT4 seems to be on the top of the evolution of interface design. Also, I must admit the convenience of the popular Ninja Trader platform. The number one platform for me is MetaTrader, though.
Before beginning, I will add a short comment. About a year ago, I switched from MT4 to MT5, but the difference between these versions is minimal. The functionality of the two versions of the MetaTrader platform is almost identical, so all the instructions in this article are suitable for MT4 as well.
After installing the platform, you need to open a demo account. You can do this either in your broker account by finding the appropriate button or right from your MT platform. To open a demo account from the platform, you should click File > Open an Account.
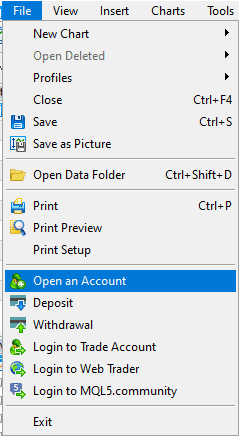
As a note, for all the programs I work with, I set the default language to English. If you want to change the language, you need to go to View > Languages menu. While you are reading my course, I also recommend using the English version of the platform for an easier understanding of information.

If you have opened a demo account through your broker’s website and the login data was sent to you via email, you should click File > Login to Trade Account.

This will open a window where you need to enter the login, password, and the name of the trading server. Check the Save account information box to automatically log in to your trading account the next time you log in to the platform.
If you lose the access to the demo account, or there is no money on it, it’s no big deal. You can open a new one at any time. Now, let’s consider all the basic elements of the trading platform in sequence.
Table of Contents
FILE MENU
The File menu has several interesting features. You already know about the buttons that are necessary to open or log in to your trading account. With the help of the Print button, you can print the whole platform window or a dashboard with the chart.

This feature is most relevant for the traders who keep a very detailed trading journal in printed form and, for each transaction, print out a table with their comments. It might be the case that this method is effective. In my course, I do not recommend keeping a diary in this way because I know that, for many beginners, this will seem to be just a routine, and they will simply throw the diary away. But the analytics is the strongest point for some people and it is a great pleasure for them to explore the transactions. In this case, you need to print a chart and make marks on it.
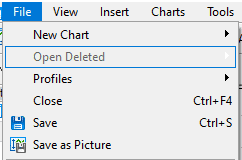
If you have accidentally closed the table with the important settings, you can restore it using the Open Deleted button in the File menu.
The following feature is an important one and I recommend that all traders use it if you are trading many different financial instruments. It makes no sense to keep more than 6-8 charts at a time – even on the big screens – especially if they contain the indicators and the other graphic elements. To optimize space, it is better to save your desktop as a profile.
A profile preloads your current settings, including the windows with tables, a set of indicators printed on the charts, oscillators, and graphic elements with all the settings, the location of the windows, and so on.

The screenshot below shows one of the standard built-in MT4 EUR profiles.

In the work area, you can see the chart of the EUR/USD currency pair in four timeframes: 30 minutes, 1 hour, 4 hours and 1 day. Each chart contains MACD, Stochastic and RSI indicators. Also note that, in the windows, a green-on-black color scheme (the type of chart is a Japanese candlestick) is applied. Later, I’ll show you how all this can be changed.
For different types of assets, you can create different profiles and switch them either through the profile tab in the File menu or with the help of following keyboard shortcuts: Ctrl + F5, Shift + F5.
For example, you can create separate profiles for different currencies, a separate one for cryptocurrency, and a separate one for stocks.
It is too early to talk about the function of loading historical data in MetaTrader, so let’s move on to the next tab.
VIEW TAB
The View tab is responsible for displaying various elements of the platform interface. We have already analyzed the very first function of choosing the language at the beginning of the lesson.
The Toolbars tab allows you to turn on and off the toolbars under the menu that we are currently talking about. This is a standard panel that includes various interface elements (the same ones that can be turned on and off in the View tab), as well as the chart toolbar, graphic elements, and timeframes. You can also customize each panel individually.
![]()
I recommend that you tick all the boxes, thus activating all the toolbars. Below you can turn on and turn off the individual elements of the interface, each of which will be discussed in this lesson. It’s high time to list and understand why you need each one of them.
MARKET WATCH
Market Watch button (or Ctrl + M key combination) displays a list of trading tools available for trading.
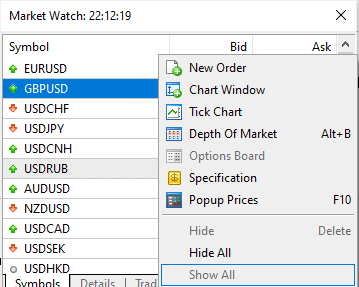
Please note that there are quite a few instruments in my list. The fact is that, in your watch list, all the elements can be hidden by default. Click on any instrument with the help of the right mouse button and you will see the Show All and Hide All buttons. After clicking on Show All, all the available tools will be displayed.
You probably understand that, by clicking the Hide button or pressing the Del key, you can hide certain instruments from the list. Within 5 minutes you can configure several instrument sets. For example, you can configure a cryptocurrency set that will only display this type of instrument in the Market Watch table.

MetaTrader offers three ways to open a tick chart where each quote movement is displayed. This is a button in the Market Watch tools menu, the Tick Chart tab, and the space bar.

In the Market Watch menu (which is opened with the right mouse button), you can expand the table by adding columns, wherein each instrument there will be displayed the information about the spread, the minimum and maximum of the current day and time. You can also hide or display the table grid that separates the boxes.
From the Market Watch chart, you can either drag the instrument into the work-space by opening the chat window, or press the right mouse button and click the Chat Window button.

Opening transactions through Market Watch is not very convenient, but you’ve probably seen the New Order button and understood what it is for.
DATA WINDOW
The Data Window displays the data related to a particular instrument. It can be switched just by pressing the left mouse button. For example, if there are 4 charts in the work-space, click on one of them, and in the Data Window, the data on this chart will appear.

NAVIGATOR
Navigator helps you quickly switch between your trading accounts and quickly find the necessary indicators, advisers, and scripts. Similar to Market Watch, you can easily drag the necessary indicator to a chart.

TERMINAL
The terminal is responsible for everything that concerns transactions. The Trade tab displays the active trades, balance, equity, and free funds on the current account.
The main thing to be shown in the settings tab is the way to display the profit of a given trade: money or points. I highly recommend leaving the display in points. This insignificant setting can seriously affect your results.

The Exposure tab displays the status of assets in all the open positions. I do not use it, so I will not describe it in detail.
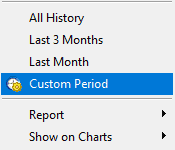
The Account History tab is the most useful one after Trade. The key feature here is uploading the detailed transaction reports. By clicking the right button on the empty area, you can select the reporting period: for all time, the last 3 months, or the last month.
I have developed a free tool to analyze metatrader reports. try it to understand how stable your trading strategy is.
We will work closely with a detailed report on trades when it comes to analytics. The report is extremely informative; it contains all the necessary statistical indicators and it displays the efficiency of your trades for the reporting period in the form of the chart.
One of the key features of reports is the ability to drag a transaction from the history into a chart, after which it instantly appears in the form of the arrows. In this way you can visually analyze the points of entry and exit once again.
You will not need the rest of the terminal tabs at the first stage, so I will not fill your head with any extra information. Return to the top menu and the view tab where the strategy tester is after the terminal.
STRATEGY TESTER
The strategy tester of the MetaTrader 4 program is a fantastic tool that allows you to reproduce all the movements of the price of any instrument applying your strategy on it in real-time. This means that if you have designed your trading rules, you can quickly render the rasterization of charts, for example, of the EUR/USD currency pair, in fast forward mode, and guess what trades you would make at one or another point.

We will work with the strategy tester on the third level of training where we will develop and test trading strategies. I will tell you about all the functions and settings of the tester, as well as about its alternatives, in the corresponding lesson.
To finished the overview of the View tab, I will mention the function of expanding the chart to the full screen, which can also be activated by pressing the F11 key.
Speaking of the hotkeys, there was already quite a lot of them in this lesson, and the beginner will be unable to remember all of them at once. If you are just starting your way to trading, remember only that F9 key opens the opening order window. All the other keys are not necessary at the moment; do not try to remember them.
INSERT MENU
The Insert menu is responsible for inserting the following technical analysis tools into the area with the chart:
- Indicators
- Lines
- Channels
- Gann Lines, Fans, and Grid
- Fibonacci Grid
- Geometric Figures
- Badges
- Text Comments
We will talk about each tool in detail at the third level of the course, where we will understand the aspects of technical analysis. I do not use the Insert menu since all the necessary tools are in the Line studies toolbar, which is turned on by default (if not, turn it on in the View > Toolbars menu).
CHARTS MENU
The Charts menu is very useful for the analytics process since it allows you to quickly figure out the objects that are plotted in the chart. In the Price Action lesson, when you build different figures on the chart, you will inevitably face the fact that some lines and figures are poorly built and they need to be removed. Sometimes, it is not so easy to select the necessary item on the chart and delete it with the Del key, and the Charts menu helps in doing this. In the Objects tab, you can open a list of all the items that are currently on the chart.

You can correct or delete the item you want by marking it (it is almost always easier to delete and depict it again). In the Objects tab, you can also delete all the objects and all the arrows (marks) on the chart with the help of one action.
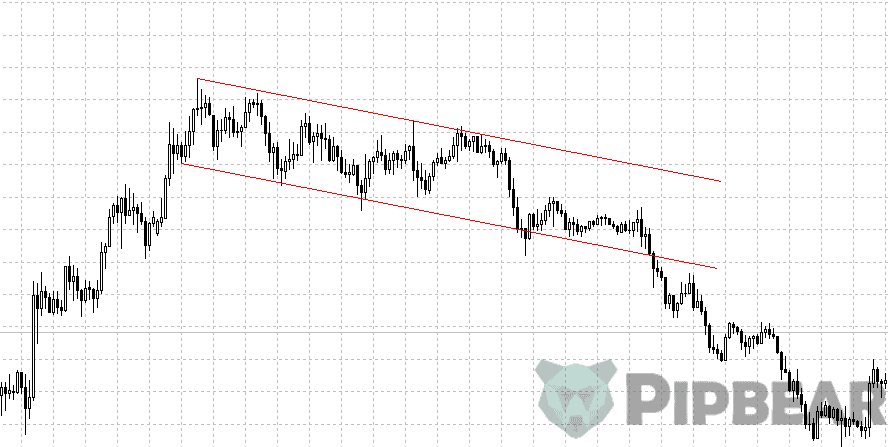
In the Charts menu, you can also choose the type of the chart (bars, candlesticks or lines), but it is more convenient to do it in the toolbar. I have worked with candlestick charts all my life, so, in all the lessons, we will work with them.
The Foreground chart is an interesting feature that has all the graphic elements on the chart, without overlapping it. I recommend checking it by turning on the function.
I will not focus attention on the timeframe selection menu, since it is on the toolbar, but rather I will dwell on the Template menu.
TEMPLATES
- Templates allow you to save and apply a set of technical tools on any chart.
Template differs from the profile by the fact that you save a specific set of charts in the profile, and the template can be applied to any trading instrument. You can save your set of indicators and apply them to any chart in 2 clicks.
- The Grid button removes the grid from the chart.
The rest of the functions are available both in the toolbar and in the menu that appears when you click on the chart window with the right mouse button. (You’ve probably noticed by now that almost all of the necessary features in the MetaTrader 4 and 5 platforms can be implemented in at least three ways.)

With the help of zoom, you can zoom in and out on the chart window. Let’s take a closer look at the Properties menu, which is opened by the F8 key. This menu is responsible for the visual appearance of the chart window. In the first tab we select the color scheme:
- Yellow on black
- Green on black
- Black on white
I am used to the black on white scheme. However, on the right side you can specify your color for any element of the chart. It should be noted that these settings are set for each chart separately. This means that, by opening a new chart, there will be standard settings in it, so once again I advise you to save profiles. My settings for the second tab look like this:
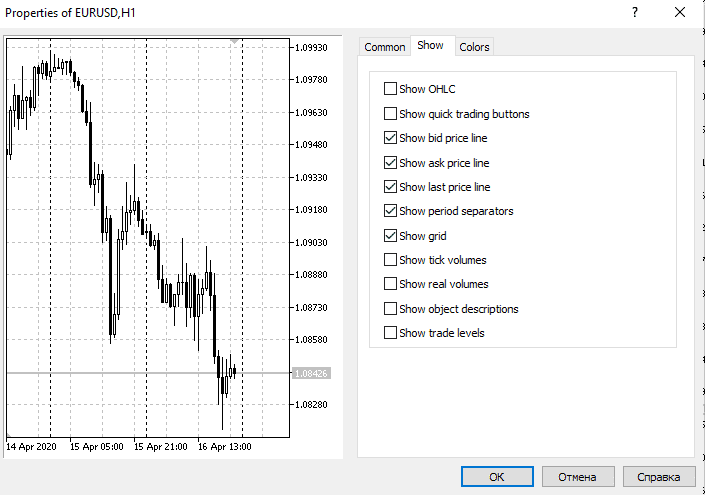
I turn on the chart shift function so that the chart does not resist the quotation field. If you do not turn off the auto-scroll, you will not be able to wind the chart back. Auto-scroll is useful if you work with short timeframes like 1 minute and it is easier when the chart rewinds to the last candle automatically.

I also recommend turning on the Ask line display. In this case, the current quotation will be shown not by one, but by two lines containing the purchase price and the sale price, the difference between which is the spread.
We are finishing work with the top menu. I will skip the Tools tab which we do not need for the main course. The Help tab contains links to useful materials on applying the trading platform and links to the MQL5 community website.
WINDOW TAB
The Window tab is worth paying attention to because there are several presets that allow you to conveniently arrange several windows of charts. Most traders do not use the readymade presets and arrange charts as they wish. However, try to click on the ready options; maybe you will like some of them.
Pay attention to this button in the toolbar:
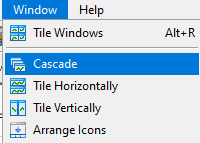
After clicking, all the windows will be aligned uniformly across the width which I find to be very convenient. In general, most traders who do not sell a large number of instruments at the same time open 1 chart on the entire area, scrolling across the chart and just switching tabs.
On the other hand, if you need to monitor the instrument on several different timeframes for analysis, place several charts in the workspace.
At this point my review of the MetaTrader 4 trading platform is coming to an end. It is time for the first homework in this course.
HOMEWORK
- Install a trading platform for any broker from my ranking and open a demo account.
- Remove all the charts from the workspace.
- Create 4 windows with the USD/JPY currency pair chart with the following timeframes: 5 minutes, 1 hour, 4 hours, 1 day.
- Move the Moving Average indicator to the chart with the timeframe of 1 day.
- Adjust the color scheme and display all the charts in the form of Japanese candlesticks.
- Save your trading profile.
- Save the area with charts as a picture.
- Turn on the Ask price display on the chart.
- Make 10 transactions on your demo account.
- Download a detailed transaction history report.
I hope you do not skip your homework and complete all the 10 points. If you read the article from the beginning to the end, you can complete all the items in 3 minutes. Write in the comments on how much time you spent on your homework.
See you at the next lesson!
Yours sincerely, Pipbear


I am using MT4 platform too but there are some less ideal features. For example, New Order table does not have memory for SL and TP in pips;
One issue I have with MT4 is the variability of trendline accuracy when swapping between time frames. Do you have any advice PipBear?
MT4 is the best platform. I like the “Alerts” feature the most
Hi..i use MT4 platform because it i find it to be extremely simple n functional…fr charts as well as execution of trades..
I certainly an in love with MT5
Thanks for the invaluable insight
Thanks for the invaluable insight