

If you are reading this article by accident, I strongly suggest you read the previous one that was devoted to the principles of building indicators using the example of the Moving Average.
In this lesson, we will discuss oscillators, particularly the combination of the two most popular tools, which are the RSI and the Stochastic oscillators.
If a classic indicator is locked to the price, the oscillator presents that data in relative values on a scale from 1 to 100. Its main task is to determine the overbought (or oversold) level, at which the price movement will most likely switch from the uptrend to the downtrend (or from the downtrend to the uptrend).
Any oscillator is designed to determine these levels. A trader draws the lines by default at the levels 20 and 80 (or 30 and 70). Consequently, the lower range (from 0 to 20 or 30) is the oversold level while the upper range (from 70 or 80 to 100) is the overbought level.
Traders can easily find the best moment to open the position if they take a proper look at the chart. Oscillator trading perfectly fits the classic concepts of the support and resistance lines.
Opening a short position happens when the oscillator’s chart goes through the upper level (for instance, 70).
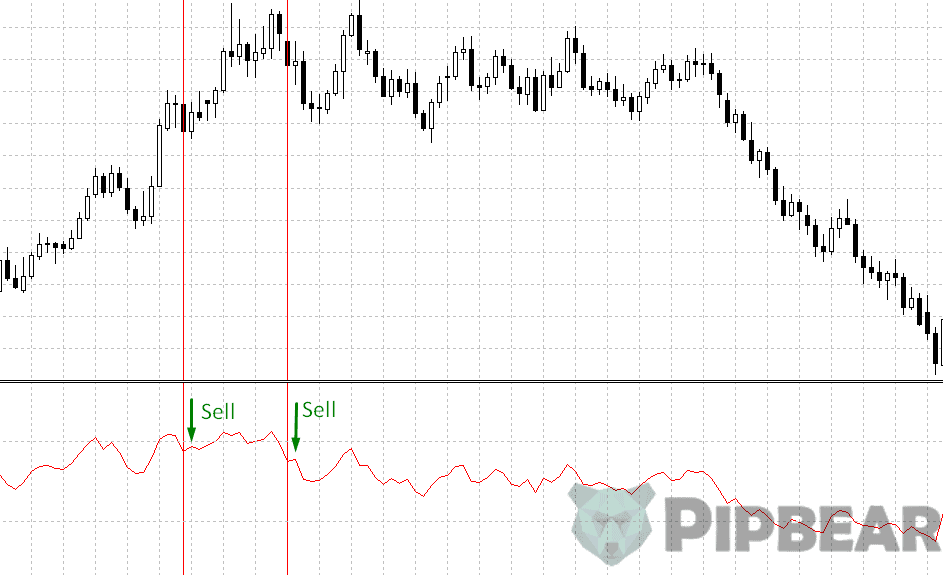
Opening the long position happens when the oscillator’s chart goes through the lower level (for instance, 30) bottom-up.

Table of Contents
Divergence as the Signal to Open the Position
You can use oscillators not only as the support and resistance levels. So-called divergence is another signal to open a position.
Divergence in forex is the discrepancy between the price movement direction of the currency pair chart and the direction of the oscillator chart movement.

The example above shows that we have connected the last two tops on the EUR/USD chart and the last two tops on the RSI oscillator chart, which we will discuss later. The resulting lines are set in different directions: the line on the price chart is directed downwards, while the line on the oscillator is directed upwards.
The oscillator data are the leading data comparing to the instrument’s price in this case and they give a signal about the trend switch.
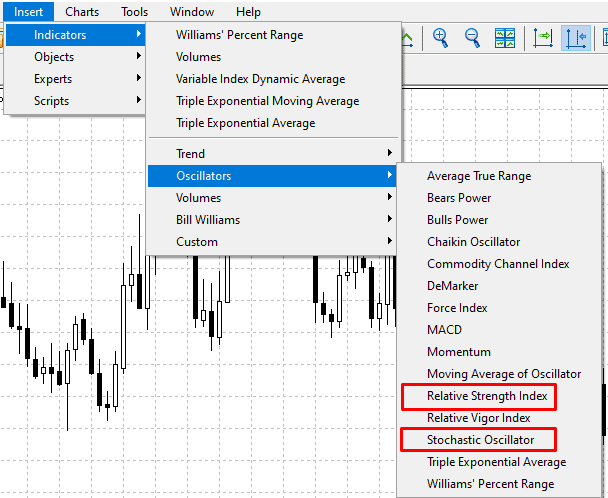
How Can We Use Oscillators?
We already discussed the ATR oscillator in the previous lesson. We have used it as the filter designed to help us determine the phase of the market and avoid excessive transactions during sideways price movement.
The oscillators are considered very helpful in channel trading. This kind of tool not only helps to determine the flat market time but also provides a signal for trading within it.
The purpose of the lesson is to offer traders an opportunity to test oscillators as an addition to their main trading strategy. Let’s take a close look at the working process using the Stochastic oscillator, the RSI oscillator and the combined Stochastic RSI oscillator.
The Stochastic Oscillator
The stochastic oscillator displays the current price point (in percentage terms) against the price range previously created over a certain period.
The Stochastic oscillator evaluates the market speed by determining the relative position of the closing prices within the maximum and minimum price range over the specified number of days. Globally speaking, the indicator deducts the price over a certain period from the current price. For example, the Stochastic oscillator (adjusted to the period of 14 days) displays the closing price position within the maximum and minimum price range over the last 14 days.
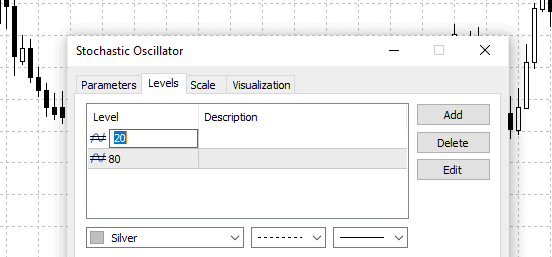
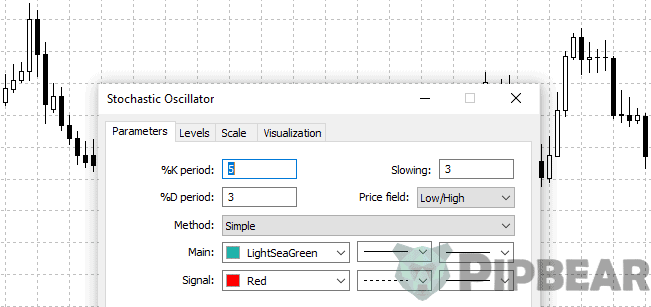
When you start using the oscillator, the system will ask you to customize the following settings.
- %K period—The %K period is the main period of the oscillator displayed in one full line.
- %D period—The %D period is the period of the moving average applied relatively to the %K period and displayed in the dashed red line.
- Slowing—Slowing is the smoothing tool. The greater the slowing value, the less sensitive the indicator to the price change.
- Price field—Low/High and Open/Close. We may pick the prices for calculation. Calculation by the Low/High prices is set by default, that is, the whole candlestick range is used. I suggest you test the second option, which implies calculation based on the Open/Close prices.
- The MA method—Simple, Exponential, etc. We can pick the Moving Average type of the %D period.
After you are done with filling in the data to the main control box menu, open the levels tab. You can set the values, which will serve as the basis to draw the horizontal lines in the oscillators’ window. As I said, the most popular combinations are 20 and 80, and 30 and 70.
The %K period is the most important period for the trader since it defines the amount of the bars used during the calculation. It is believed that the higher the timeframe is, the less period should be taken. For instance, the range from 14 to 21 fits perfectly well for the H1 timeframe. Traders often use the values 14 and 21.
I have given a lot of stuff about the signals on entering the market using the oscillator. I should only add one more thing: You can apply the same rules while creating chart analysis patterns that you would use in case of the price chart.
Relative Strength Index (RSI)
The RSI oscillator has only one key setting which is the period. The default period is 14. This indicator was invented by J. Welles Wilder, Jr. and he considered it the most important in stock trading. However, many traders prefer not to change the period.
I advise you to pick a period for each timeframe. If you use a combination of the oscillators (for example, the RSI + Stochastic oscillators), use the same period. This rule applies to all the tools. The smaller the period, the more sensitive the oscillator is to price change.
As I said, I don’t see the point in using any prices except for the closing prices in the oscillator calculations. However, if you are fond of experiments, you may try other options from the dropdown list.
The RSI oscillator, like any other oscillator, moves in the range from 1 to 100, within which you can make the support and resistance levels. We use the same algorithm as we would do in the case of the stochastic oscillator. The oscillator settings window contains the “levels” tab, where you can set the parameters of the lines. The most popular values are 20 and 80 and 30 and 70.

The main task of the oscillator is to determine the ratio between the values of the uptrend and downtrend closing prices. It sounds quite difficult, but the indicator does the following:
- It finds the bars that closed at a higher price than the current price over the period (14 bars are used by default).
- It sums all the price increases and divides it by the amount of the bars over the period. Therefore, we get the average price upward movement.
- It sums the price decreases of the bars that closed lower the current price and so we get the average price downward movement.
- It divides the average price upward movements by the average price downward movements and transforms the result into the index.
I think we should now move on to testing. I suggest testing and adjusting the oscillator’s settings in three stages.
The first stage. Add three RSI windows of different periods with identical levels to the working space. For instance, use the periods of 7, 14 and 21 and the levels 20 and 80. Our main task is to evaluate which period better correlates with the chart and provides better signals. Apart from the typical visual analysis, I highly recommend that you pay attention to the divergence and the breakout of the levels.
You can mark possible points for opening positions with the vertical levels.

The second stage. Delete the excessive RSI windows and leave the one that performed the best during the test. Let’s imagine that/.,mn, we have picked a period of 14. We should add one or two oscillators’ windows of the same period but of different levels. For instance, we were testing the levels 20 and 80 on the previous stage and now we are going to test the levels 30 and 70, and 25 and 65. Run the test once again and determine the levels that performed the best as the support and resistance levels.
The third stage. Delete the excessive windows and, finally, we get the period and levels as the result of the test. Now all we have to do is to test the strategy in the MetaTrader tester. My course contains a lesson devoted to this topic and if you missed it, I do advise you to go through it.
Level 50
You should pay attention to the fact that many traders use the level 50 apart from the overbought and oversold levels (30 and 70 by default). Level 50 is the line that goes through the middle of the oscillator window.
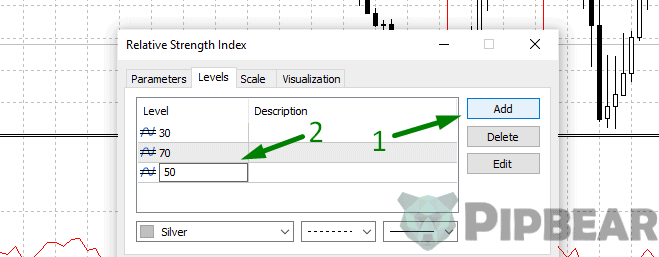
I must tell you that I never use it since I don’t see the point in working with this level. If the lines 30 and 70 are used to determine the price trend switch within the short time range, the level 50 can be used in at least two different ways:
- As the support and resistance level.
In this case, we do not need any other lines and we shall open a long position when the level 50 is crossed bottom-up and the short position when it is crossed top-down.
- As a signal of trend confirmation.
When the price crosses the middle level of the oscillator, you can consider this as a strong price movement. In such a case, it is unlikely that the price will return to the levels 30 and 70, but it is still far from reaching the oversold/overbought levels. Consequently, a trader might consider this level quite safe. That would mean a greater stop-loss order, which increases the percentage of profitable trades than if you open the positions on the levels 30 and 70. If you miss the point, please feel free to leave a comment and I will do my best to explain it to you.
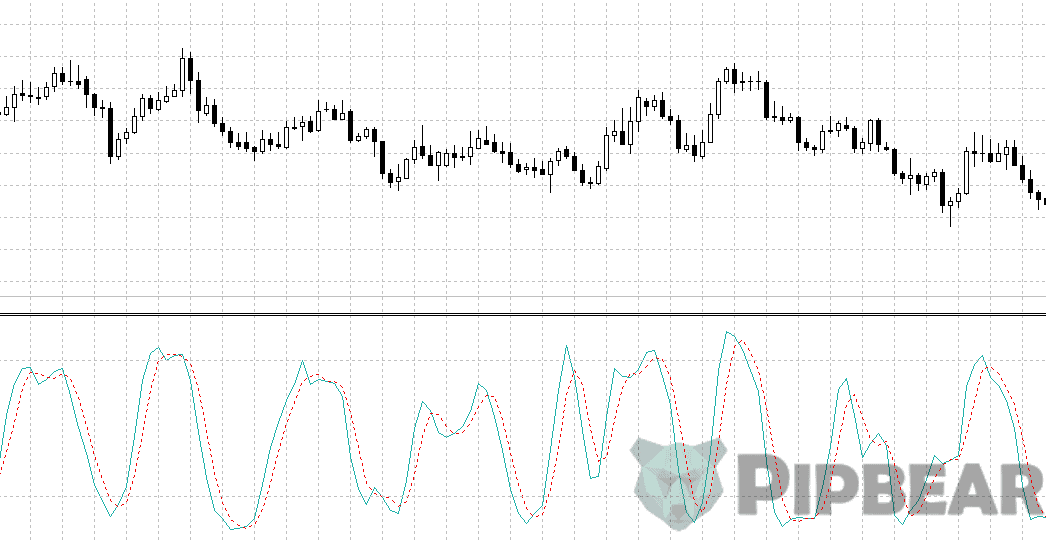
Stochastic RSI
Many traders use the combination of the RSI and Stochastic oscillators to determine market entry points. In other words, the signal to open a position occurs when the support/resistance levels are crossed:
- On the price chart;
- on the RSI; and
- on the Stochastic oscillator.
I would like to tell you about the custom-made decision by Stanley Kroddle and Tushar Chande, which is called the Stochastic RSI oscillator and combines two popular tools in one:
This combined oscillator is designed to solve the problem that the price rarely reaches the oversold or overbought level zones in case of the usual RSI and Stochastic oscillators. In fact, the new oscillator reacts sharply and provides an increased amount of the signals about short-term trend changes.
You should read the Stochastic RSI oscillator’s values the same way you do with the Stochastic oscillator. However, you should not use the asset prices but use instead the RSI data, that is, the price rise/fall ratio.
You cannot see this oscillator in the standard MT4 tools but you can easily find it using Google search, download it for free, and install it to your trading platform.
If you find it interesting, try to test this technical tool the same way we test the Stochastic RSI oscillator.
Key Conclusions of the Lesson
I think we are about to finish the lesson on the oscillators and it’s time to make some key conclusions.
- The point of any tool a trader uses to analyze the market is to find the patterns. What we should learn from this lesson is how to find the patterns in the oscillator’s windows, compare them to the price charts, and create new rules for our trading system that will bring us a profit in the long run.
- Oscillators such as the Stochastic and RSI are perfect in case of the sideways trading but inapplicable in case of a strong market trend. This is because the oscillator’s line will always be in the oversold/overbought level zone during the trend and will cross the support/resistance levels at each slightest reversal movement.
- Oscillators can be combined with many other chart tools and technical analysis. The key task of a trader is to understand the indicator’s basis and the kind of signal you want to receive. After that, all you have to do it to run the tests.
I think we should finish this lesson on the oscillators now. I would be happy to see your thoughts about the article in the comments. I hope we shall meet at the next lesson, in which we will talk about the main ways to determine the support and resistance levels.


I usually use a combination of Bollinger Bands and RSI plus appropriate trend lines.
Indicators are very powerful tools if used appropriately
The explanation was very straight forward, straight to the point. Valuable points
I was wondering if I can work on pure price action, no charts, I find many people advocating for plain charts
This is the best article so far I have come across….. Any technical trader should make this part his reference point. Thank you pip bear
Thank you! I look forward to a profitable future
How do you handle lagging indicatos? Are they even important to traders. Thanks PIPbear
Please make some videos for these topics, can’t wait to watch them