

We continue our in-depth learning of those indictors which became classic, have brought millions to exchange players and are used today by thousands of traders around the world. Today, we’ll talk about Bollinger Bands (BB) or the standard deviation range of Bollinger (also known as Stripes or Bollinger Bands) indicator. Let’s see the things it shows, the strategy application in trading and … something else interesting).
Before reading the article and writing your questions in the comments section, I recommend to watch this video. It’s not long but covers the biggest part of questions on the topic.
Table of Contents
Introduction
This indicator was first described by Perry Kaufman in 1987 in his book The New Commodity Trading Systems and Methods. Later, the indicator was widely spread thanks to John Bollinger, an American technical analyst from California and this remarkable indicator’s author.

John Bollinger was born in Montpellier, France. Later, his family decided to move to New York. John has been interested in cinema and photography since his childhood, that’s why he entered the visual arts school in New York, where he received the light operator profession. By the way, the operator’s profession was quite simple for him, so he moved to West Hollywood in 1976.
But his life meaning and interests changed from the moment when his mother asked him to see her investment portfolio. He forgot about the operator profession completely, although it helped him to get the operator job in the financial news channel where he could personally observe financial analysts’ work and absorb important information.
After completed training in analytics and obtaining the necessary knowledge, he got the channel sales analyst job. His career on TV channel was rather short, in 1991 TV channel was bought by CNBC, although there is presented analytical news from John Bollinger once a week. He has been developing his own system of rational and efficient analysis, later called “Bollinger Bands” during the period from 1984 to 1991.
This analysis tool is still popular today. His book Bollinger on Bollinger Tape is a detailed guide about the way to use this tool both individually and in conjunction with other indicators. And in 1996 he as recognized to be the best software developer for financial analysis.
Indicator description
Graphically, Bollinger Bands are two lines which limit the prices dynamics up and down. These are original support and resistance bands which are located at levels remote from the price most of the time.
Bollinger Bands are similar to moving averages envelopes. The difference between them is the envelope’s boundaries are located above and below the moving average curve at a fixed distance specified in percent, while Bollinger Bands boundaries are built at distances equal to a certain standard deviations number.
Since the standard deviation magnitude depends on the volatility, the bands adjust their width themselves: it increases when the market is unstable and decreases in more stable periods.
The following statement is the main rule in Bollinger Bands construction: about 5% of prices should be located outside these bands and 95% inside.
Bollinger Bands are formed of three bands. The average band is the usual moving average. The top band is the same middle band, shifted upward by a certain number of standard deviations (for example, by two). The bottom band is the middle band, shifted down by the same number of standard deviations.
Bollinger bands uniqueness is in the fact that their width changes in response to a change in market volatility. Bollinger Band is constructed as a band around the middle one, but the bandwidth is proportional to the standard deviation from the moving average for the analyzed period.
When there is a big volatility in the market, for example, the band expands during news release time and I narrows when there is lull in market.
I recommend analyzing BB together with other indicators. BB indicator is intended for the determination of the sharp deviation from the average rate of the current trend of the currency pair. If BB is matched correctly, their moving average (central band) is a good level of support/resistance, and BB boundaries can serve as targets when opening positions. Usually BB is placed on the price chart, but they can also be applied to any indicator which is drawn in a separate window, for example an oscillator.
Bollinger Bands define natural extremes in developing trends. If Bollinger bands are striving up, the price makes a rebound until a powerful enough force stops the price movement. The stagnation zone is formed below the upper or above the lower Bollinger.
The stagnation state can continue until Bollinger turns around and starts while opening up to move away from the price bar, which will indicate the resistance is overcome. Price can move towards the current trend and stick to the Bollinger edge. However, it’s necessary to pay attention to the fact the final price movement depends on all levels of support/resistance levels and not only on those which BB is associated with.
Do not try to find the ideal conditions for opening/closing positions. Learn the way to work in imperfect conditions when receiving false signals.
BB indicator calculation

Bollinger bands are formed of three bands. The average band is the usual moving average. In the following expression, “n” denotes the number of unit periods that make up the moving average calculation period (for example 20 days).
The top band is the same middle band, shifted upward by a certain number of standard deviations (for example, by two). “D” means the number of standard deviations in the following formula.
The bottom band is the middle band, shifted down by the same number of standard deviations (i.e. by “D”).

Bollinger recommends using a 20-period simple moving average as the average band and 2 standard deviations for calculating the band boundaries. He also found that moving averages of less than 10 periods are ineffective. Let discuss the indicator settings in more detail.
Period
For Bollinger Bands it is recommended to set the period from 13 to 24, the most common is 20, and the deviation is from 2 to 5, the recommended value is 2 or 3. It’s possible to use Fibonacci numbers, round numbers 50, 100, 150, 200, number of days in the trading and calendar year – 240, 365. It should be understood that the establishment of large periods reduces the sensitivity of the indicator, which is unacceptable in markets with low volatility. The main time the price is in the channel, but the intersection of the Bollinger bands is considered to be normal while having a sharp movement. However, if the price crosses the upper or lower band too often, it is better to increase the period, and if the price rarely reaches the external bands, then it is better to reduce the period.
Price
Closing prices are most often used to calculate Bollinger Bands. Such other varieties as typical and weighted prices can also be used.
Timeframe
Bollinger bands work equally well on any timeframes, but, as a rule, they are used for intraday trading.
It is worth remembering that the indicator settings should be selected separately for different currency pairs and timeframes.
Application methods
The developer notes the following features of the Bollinger bands:
- Sharp price changes usually occur after narrowing the band, corresponding to volatility decrease.
- The current trend continuation should be expected if the prices go beyond the band.
- The trend reversal may occur if the peaks and troughs outside the band are followed by peaks and troughs inside the strip.
- The price movement, which starts from one of the strip’s borders, usually reaches the opposite boundary. The latter observation is useful for forecasting price benchmarks.
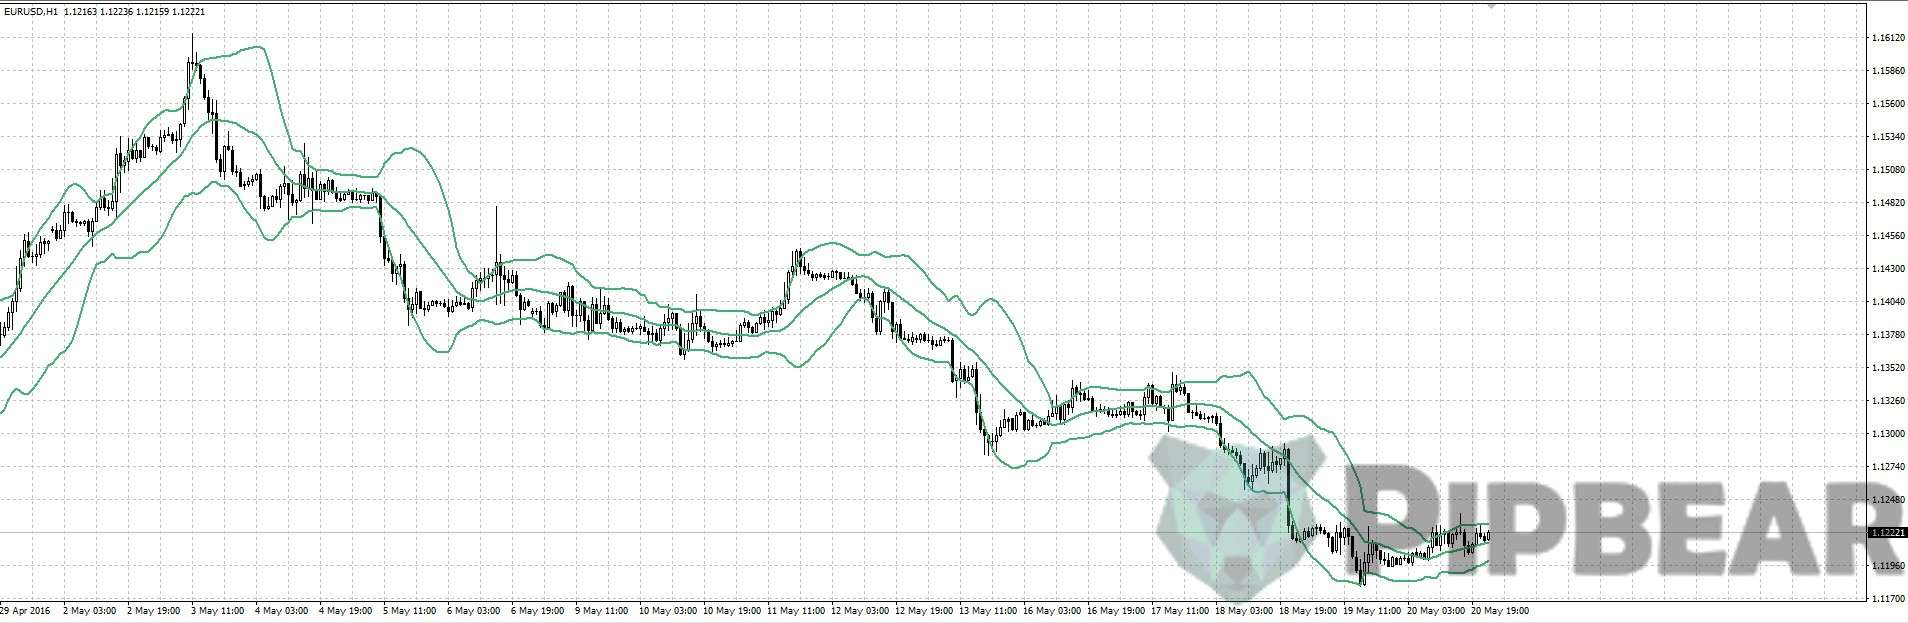
As a rule, going beyond BB means the trend start or continuation. Thus, it’s possible to conclude the market direction – while prices touch and break the upper limit, the trend is upward. As long as prices break through the bottom, it’s downward.
Sometimes going beyond the Bollinger Band means false breakdown, i.e. when the prices just tried a new level and immediately returned. In this case, you also have an opportunity to work against the trend, but carefully evaluate – whether the “breakdown” is indeed “false”. However, it is necessary to consider the trades against the trend are game for professionals. And if you still do not feel yourself to be a real professional, don’t play this game.

Such opportunities are indicated in the figure above. Note that such countertrend opportunities appear countertrend opportunities and they are characterized by a strong going beyond the indicator’s boundaries. Such situations are usually visible rather clearly.
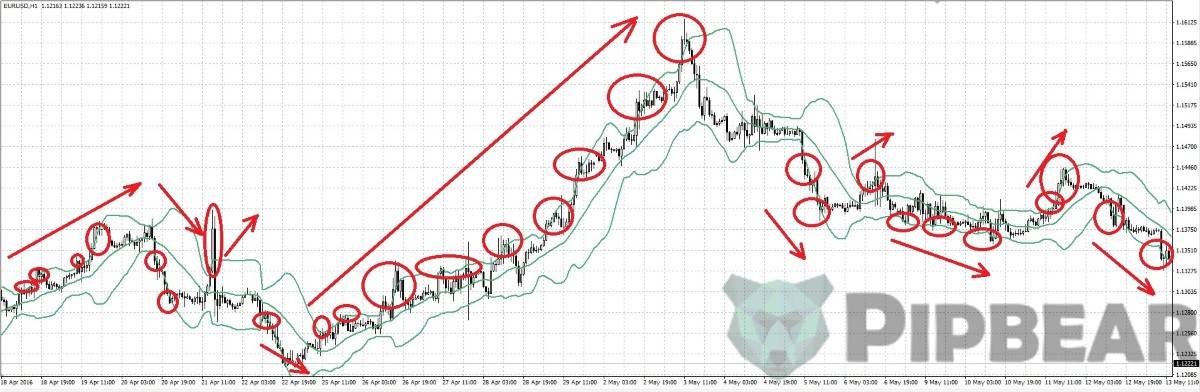
BB average band reject and its intersection by the price
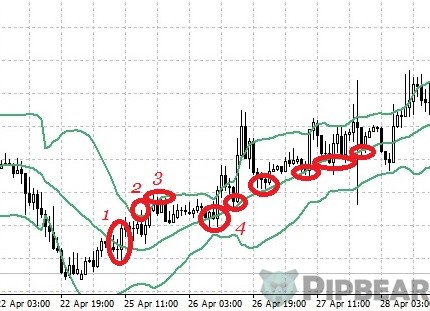
As I previously said, the correct selection of the indicator period turns the average BB into a dynamic support/resistance level, which works perfectly on the confirmed trend. Crossing the average band of the indicator often means changing the trend. In the figure above the trend was crossed at point 1, at point 2 the trend change was confirmed (the prices touched the upper border of the indicator). The prices touched the upper boundary again at point 3 until point 4 touched the average band. Confirming the point by candlestick formations, other indicators or chart analysis (levels, trend) gives us a reliable entry point towards a new band.
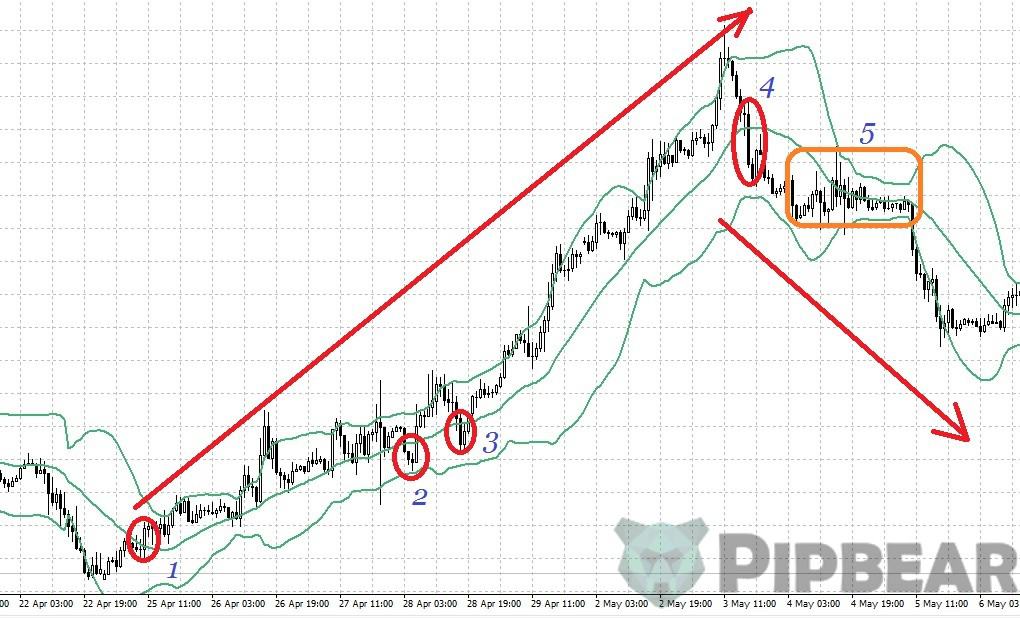
Note that after changing the trend at point 1 of the figure above, the price returned many times to the average BB and rejected from it. However, at points 2 and 3 there were also approaches to the average band. At the same time, it was broken, but trend change was absent, these were false breakdowns.
That is why it is recommended to refuse from relying on one indicator when making trade decisions but filter all incoming signals with the help of oscillators, candles, chart analysis. At point 4 again, the average band breakdown took place, which led to another interesting phenomenon (point 5), which would be discussed below.
Bollinger Bands slope and price location relative to BB

Everything is simple. According to Bollinger slope, as well as finding the price relative to the average band, it’s possible to see the current trend direction – the trend is up when BB is inclined up, the trend is down when the BB is inclined down. Finding the price under the middle band indicates a downtrend, the price location above the middle indicates an uptrend.
Bollinger bands range narrowing and expanding

Everyone knows the market can move from the trend phase into the stagnation phase, it happens constantly. And when we see that the market has a long enough time to calm – it is worth waiting for the storm. Bollinger range becomes wider when market volatility grows and when it falls. Narrow Bollinger range indicates a sleepy, calm market.
The strongest market movements usually start from a flat base (“shelf”). Bollinger range helps to determine the moment of changing from calm to an active market. When prices rise from a very narrow Bollinger range, it gives a buy signal. When the prices fall from a very narrow Bollinger range, it gives a sell signal. If prices return to the range, it’s necessary to close the position.
BB divergence is observed with the current trend strengthening or a new trend start. The longer the rate is traded within the narrow limits of the price channel (flat), the stronger and more rapid will be the exit from it. In response to the price awakening, BB strips are revealed. If the price is approaching the BB border, it will start to grow, most likely the movement will continue.
It’s possible to catch a new trend start if watching for the strips in real-time by the trained eye. Bollinger bands work especially well during the second testing of important highs or lows levels by the price. When the market finally breaks out, the expanding price bars reach the Bollinger Bands boundaries, then the bands narrow around the narrowing price bars in the side range. Then there is the level reject.
Trend continuation and reversal
Powerful purchases and sales can bring the price out of the Bollinger Bands. Experience shows that in most cases no more than four candles go out beyond the Bollinger band, after which a correction or reversal takes place. However, trading against these movements is very risky since the market can take a short series of very volatile fluctuations before the turn occurs and break your stops. But, in general, such a price behavior is observed quite rarely, usually during the London session, on the news.
As it was mentioned earlier, the indicator directly depends on market volatility. If the channel boundaries expand, this indicates a continuation of the current trend and if the external Bollinger bands narrow, this may indicate a trend fading and a possible reversal. BB central band breakdown strengthens the directed impulse.
If, when the price approaches BB boundary, the border inclination decreases, then, most likely, the price breaks the border and then turns. Very often this means the current trend termination. Carefully watch, whether the price will reject slowly and whether Bollinger will open at the same time. If yes, this will be a signal for the forthcoming breakthrough of the BB border and the movement continuation.
Models recognition with Bollinger Bands

For example, let’s take the “double bottom” model, which consists of reducing to a low, followed by a recovery and then lowering to the previous low, after which a turn occurs, accompanied by a growth or at least the previous trend termination. The relationship between these two lows was the topic for discussions among technical analysts during a certain time.
Whether the first low should be higher than the second or should the lows be equal, or should the second one be higher? and so on … I think the process of identifying these models becomes much easier and the models themselves become more obvious if considering lows regarding Bollinger Bands and ignore the absolute price values issues.
If the first low is located below the lower band and the second low is located lower or above the lower band, we have a potentially interesting setting: a divergence where the second low is relatively higher than the first, regardless of their absolute price levels. Add a confirmation and appropriate discipline here – and you will get a valuable tool for trading.
Bollinger bands application with other indicators
As a rule, BB is used in trend systems, where the entry is made in the direction of the trend after some rollback. In addition to supporting the middle BB, it is logical to use the oscillator to confirm the rollback termination.

Stochastic oscillators or WPR are appropriate for this task.
Bollinger Bands’ advantages and disadvantages
The attractiveness of the Bollinger Bands for traders consists of two very important characteristics. Firstly, Bollinger bands (BB) show the main axes of trends/side ranges like it is made by price or moving averages. Secondly, they are narrowing or expanding when moving.
And the mentioned properties interaction of Bollinger bands determines unique models as the price bars pass through certain boundaries while developing their movement. Japanese candles work especially well with Bollinger Bands. So, for example, “Doji”, colliding with narrowing bands, gives an effective signal for a short-term price turn.
Bollinger bands (BB) react to the price movement with their peaks and troughs. These undulating movements predict how far the tendency can spread before the distribution forces return it to the central axis. A complex set of interactions develops between the price/band director and the price/band narrowing. A huge experience is required to identify the final impact of these bands on the price.
But you will not regret the efforts after sitting dozens or even hundreds of hours while watching for this indicator. Bollinger Bands indicate the hidden nature of price fluctuations much better than many other tools and immediately inform whether the treasured door behind which the profits lurk.
The indicator has the same disadvantage as the standard moving average – delay. And the higher the BB period, the more important it is. Nevertheless, many traders use BB in their trading, having learned to reduce their weaknesses and to use the strong as efficiently as possible.
By the way, if you decided to use BB in your forex trading, such an oscillator as CCI can be safely removed from the chart. It is based on the same principles as the ranges and measures deviations from MA. Ranges are better since they leave you visually closer to prices.
Conclusion
If you use moving averages in your trading, you need just to consider your trading system while using a multifunctional indicator like Bollinger. If you have not encountered moving averages or BB before, I recommend you to try its application options specified in this article – they at least are worth consideration.


When it comes to indicators, Bollinger bands is my all-time best, thank you for laying more emphasis on it
just want to say thank you ! pipbear has really been the go to for me when it comes to learning the ins and outs of trading, I must say you guys are very helpful!! Keep up the great work
Nice explanation! I have a Question, Are Bollinger Bands, in any way, weighed by the volume of the trades taking place? If not is there any indicator that combines the idea of Bollinger Bands with trading volume?
People, remember, its just an indicator dont fully rely on it. Ideally, there should be a few indicators in your favour. dont buy/sell something just because the price is low/high in the bollinger bands
Thanks for all the videos, great info as always.
Thank you for your articles are very professional. You may have already covered this but can you explain using Bollinger Bands in conjunction with Stochastic RSI and more specifically what time frames to use.
Could you please confirm that bollinger band is one of the best tools for option writing as 2nd deviation in it almost covers 95% of the underlying movements.
Good job Coach
What are the best times to trade using bollingers