

In this article, I’ll talk about an amazing classic indicator, the Commodity Channel Index (CCI). Traders use this tool to measure deviations of the current price from its moving average. High CCI readings indicate that the current price is too high compared to the average price. Low readings, on the contrary, signal that the current price is too low. As you might have already guessed, CCI is an oscillator.
Before reading the article and writing your questions in the comments section, I recommend to watch this video. It’s not long but covers the biggest part of questions on the topic.
Invented by Donald Lambert in the 80s, CCI was originally designed for commodity markets. The indicator was featured in Lambert’s book, Commodities Channel Index: Tools for Trading Cyclical Trends. CCI has instantly gained popularity among traders. Now it’s widely used to identify cyclical trends for several investment vehicles, including commodities, stocks, and currencies. Below we’ll discuss how to calculate CCI and use it to enhance your trading performance.
Table of Contents
CCI features
Platform: Any
Currency pairs: Any
Timeframe: H1 and higher
Trading time: Around the clock
Type: Oscillator
How CCI works
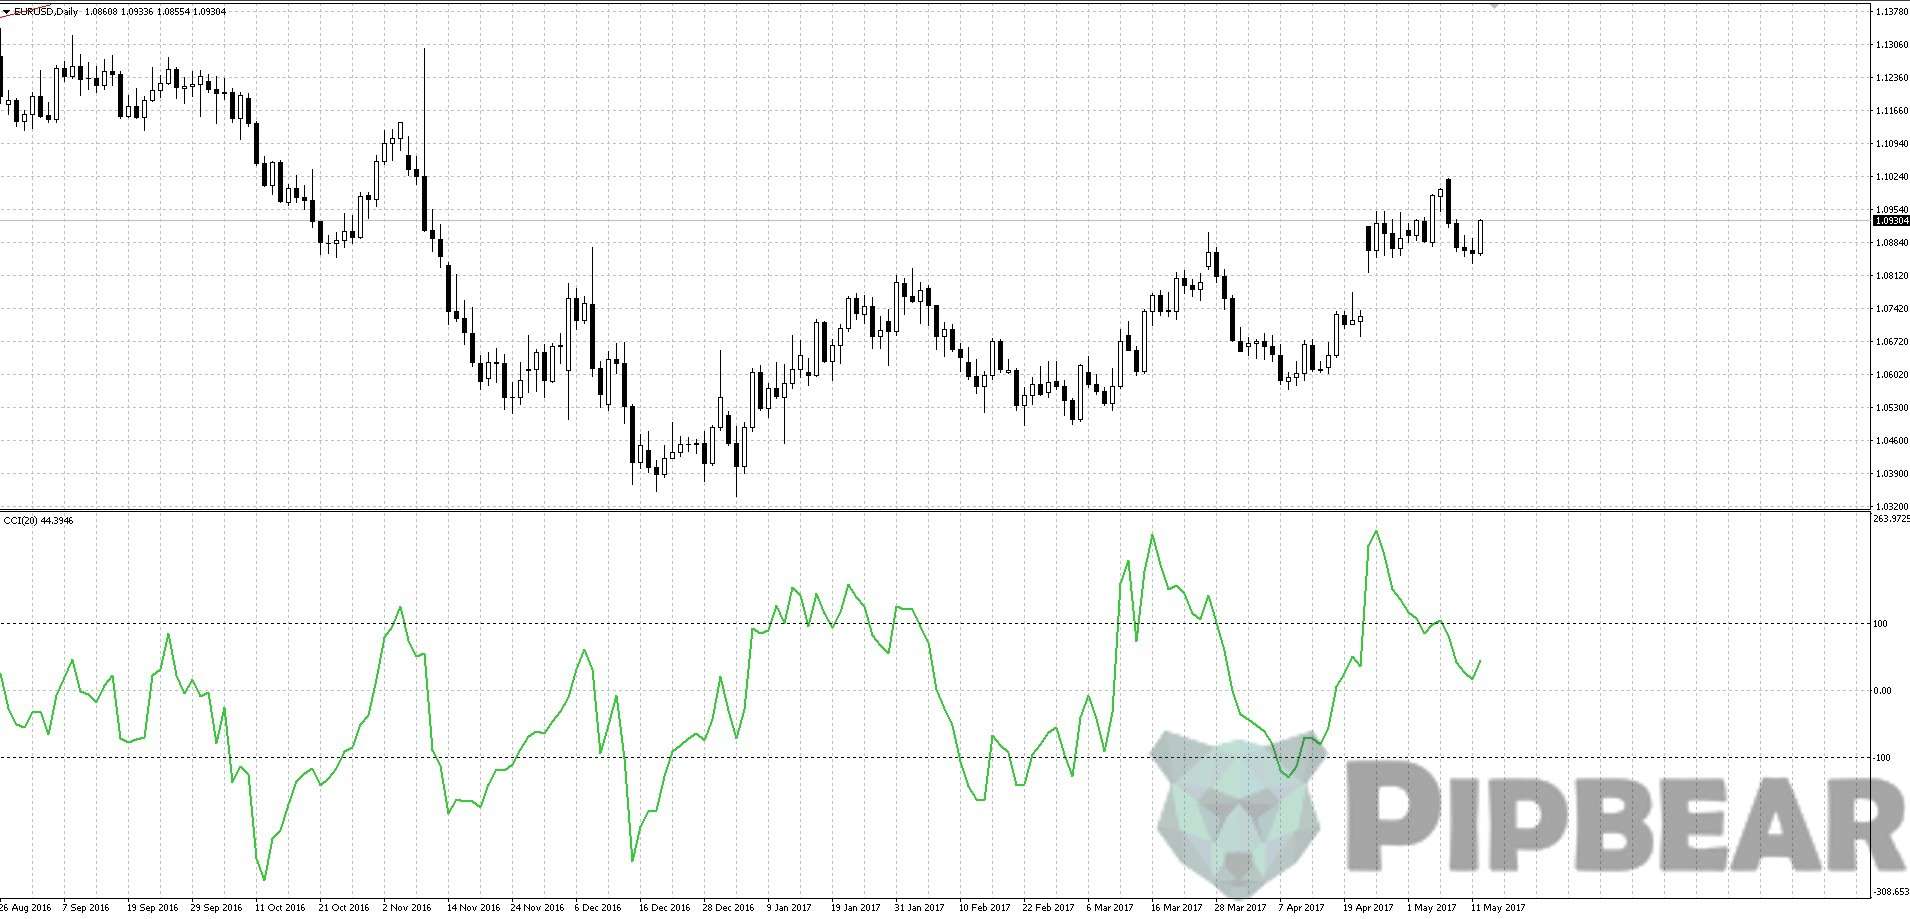
Like most oscillators, CCI was developed to identify overbought and oversold levels. CCI measures normal deviations between the current price and the moving average (the average price).
High CCI values indicate that the price is too inflated compared to the average price. Low CCI values signal that the current price is too low. The oscillator is plotted as a line that moves in the range between +300 and -300. Unlike many other tools, CCI has no limits and may fall outside the above range. On MetaTrader4, you can find CCI in a separate window under the price chart (in a so-called “footer”). You just need to input a time interval and type of price. CCI is used to identify trend reversal. When there is a bullish trend, the CCI line goes up from 0 to +100. When the market is dominated by a bearish trend, the CCI falls from 0 to -100.
Calculation
CCI is calculated almost like the average deviation. (In fact, the oscillator IS the average deviation.) Here is the formula to calculate CCI:
CCI = (Typical Price – SMA)/(0.015*Mean Deviation)
Let’s break down the calculation process step by step.
First, you need to calculate the typical price (TP). Add up the high, low, and close price for each bar. Divide the sum by 3.
TP = (HIGH + LOW + CLOSE) / 3
Calculate the n-period simple moving average (SMA) for the typical prices.
SMA (TP, N) = SUM (TP, N) / N
Deduct SMA (TP, N) from TP for each of the n periods.
D = TP — SMA (TP, N)
Calculate the n-period SMA for absolute D values
SMA (D, N) = SUM (D, N) / N
Multiply the resulting SMA (D, N) by 0.015
M = SMA (D, N) * 0,015
Divide M by D
CCI = M / D
Abbreviations:
- HIGH — the highest price of a bar;
- LOW — the lowest price of a bar;
- CLOSE — close price;
- SMA — simple moving average;
- SUM — sum;
- N — number of periods used for calculation.
Most of the random CCI values fall into the range between +100% and -100%. Once the CCI line breaks the + 100 level, look out for trading opportunities. If you’re following my ExcelTrader course or know a thing or two about statistics, you can easily see that CCI is a normal distribution of standard deviations from the average price plotted as a simple moving average. The only difference is that CCI is visualized not as a distribution chart but as a line in the chart footer. Let’s designate 100% as a sigma. About 68.2% of all CCI readings fall between +-1 sigma or +-100%; 27.2% of all CCI readings fall between +100 and +200, or -100 and -200; 4.2% of all CCI readings fall between +200 and +300, or -200 and -300. Finally, there is a 0.1% probability that CCI goes either above +300 or below -300. Based on these data, you can identify the optimal levels. Most traders use the default settings of +-100.
Of course, you don’t need to know all this to plot the CCI line on a МТ4 chart. However, by knowing what parameters make up the CCI indicator, you’ll get an idea of its advantages and shortcomings. Plus, you’ll be able to trust it more, which is also very important.
Settings
Time interval is one of the major parameters that enhance the accuracy of CCI. As the oscillator tries to predict a cycle by using moving averages, defining an exact moving average period is of great importance. This is true for most oscillators. While most traders use the default period, you can minimize fake signals by using a more accurate setting.
Here is how you can identify the optimal time interval (for a daily chart):
- Open a daily chart.
- Identify two high or two lows on the chart.
- Identify the time interval between the two highs or lows (length of the cycle);
- Divide this time interval by 3 (1/3 of the cycle).
We recommend using CCI on H1 charts and higher. On lower timeframes, the oscillator generates loads of false signals. CCI works best for sideways trends (not the same as “flat”!). If there’s a strong trend in the market, CCI’s signals against the trend should be viewed as false or warning. There is a common opinion that CCI generates the most reliable signals for EUR/USD. I cannot confirm or deny this but you should start exploring CCI with this currency pair. Here is another rule that many traders keep ignoring. No indicator (and CCI is no exception) should be used on its own. Be sure to pair CCI with other tools to ensure more accurate signals.
How to use CCI
There are several ways of how to use CCI to define entry signals. Let’s zoom in on each of these methods.
The first method has to do with breaking the signal lines. If the CCI line crosses the -100 level from below, you should open a long position. If the CCI line crosses the +100 level from above, you should go short.

The second option is to monitor the zero level. If CCI crosses the zero level from below, you should start aggressive buying. If CCI crosses zero from above, you should start aggressive selling. This is how CCI gives you an early signal about the occurrence of a new trend. However, it’s best if CCI breaks the signal lines first. After CCI crosses the -100 level from below, you should wait for it to cross zero and only then go long. For example, you’re trying to catch a trend reversal. Once CCI crosses the -100 level, you open a trade (small lot, shortstop loss). After a streak of small losses, you finally catch a trend and increase your lot once CCI crosses the zero level (which serves as confirmation).
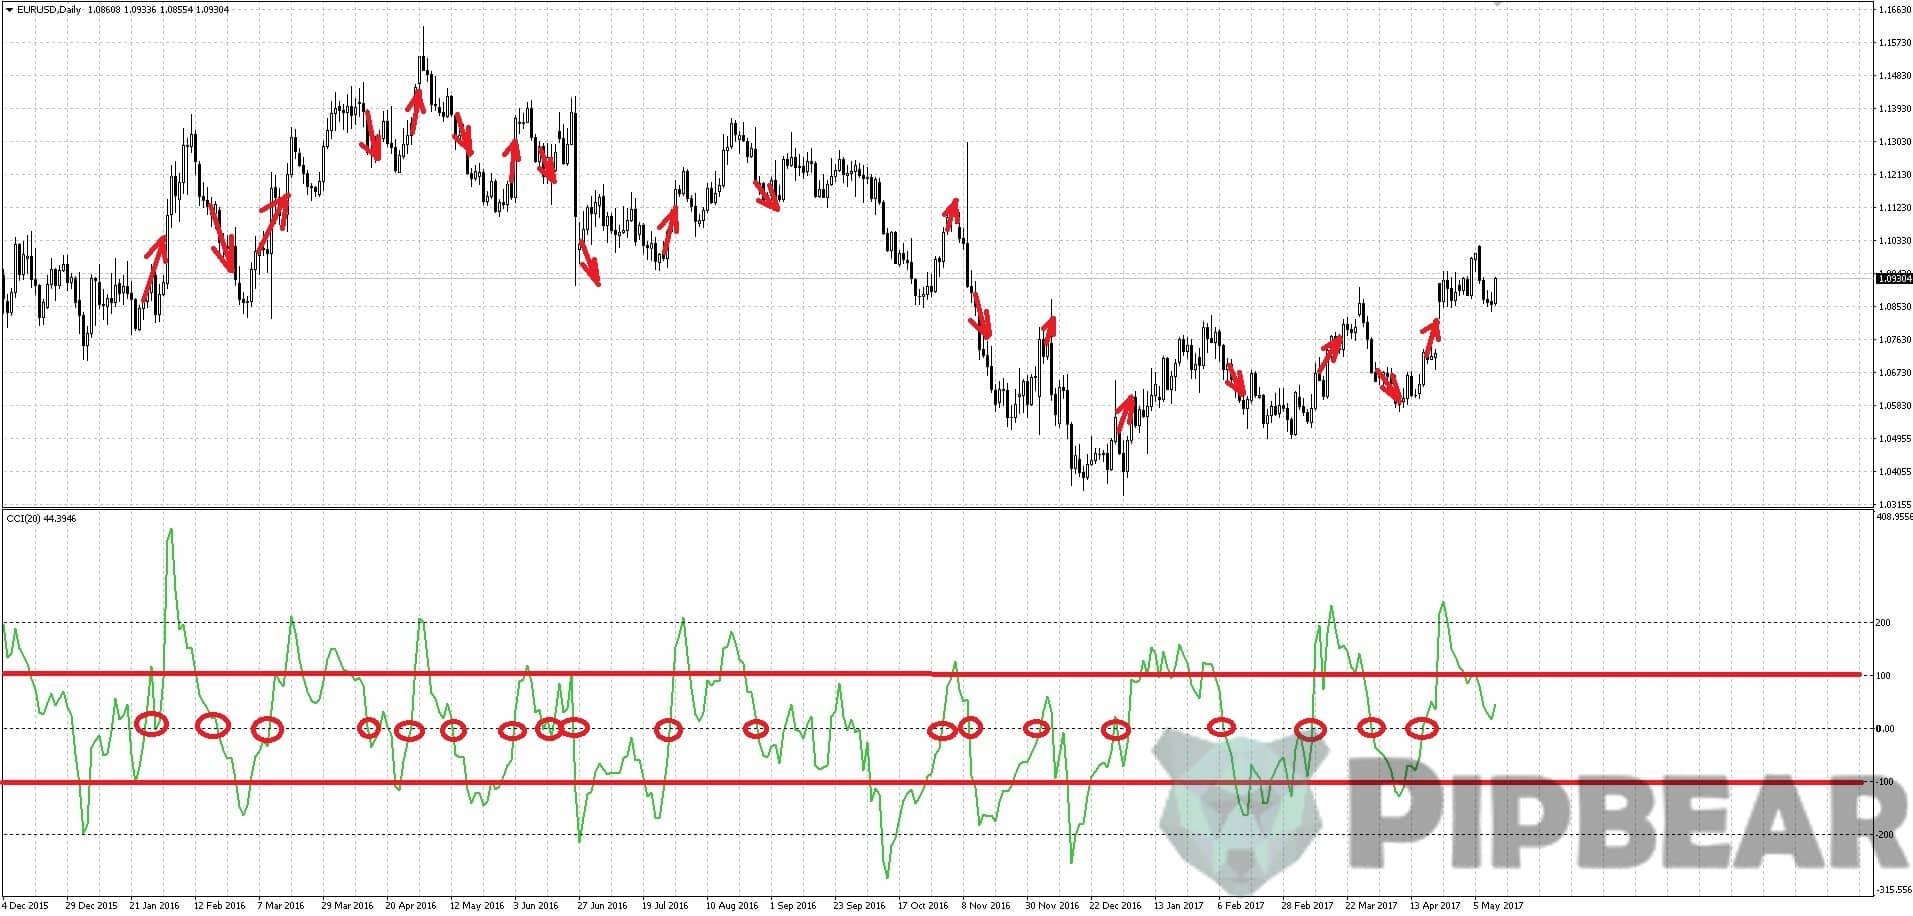
In both cases described above, CCI is used to identify the overbought and oversold levels.
The third option has to do with divergences (we’re dealing with the oscillator, after all!). We won’t linger on this issue as I’ve already covered it in a separate article. If you’ve missed it out, I highly recommend that you read it.
The fourth method consists of using technical analysis to generate signals on the CCI chart. Here you can use a variety of geometric shapes (triangle, head&shoulders, etc.). Plus, you can draw the support and resistance lines and trend lines (those are especially useful).

Now we’ve covered all entry signals but one. Don’t worry, I’m saving it for the dessert!
Entry filter
CCI is a pretty good tool to filter trades. If CCI is above the +200 level, this means that the trend is losing momentum, so don’t initiate any long trades. At the same time, CCI moving up between 0 and +100 is a sure sign that the trend is stable and going short is out of the question.
Confirmation
Let me repeat that once again: to fully benefit from CCI, you should combine it with other indicators. For example, CCI works well with pivot points as the two instruments try to identify turning points. Some traders also add moving averages on the CCI chart. Consider using a 60-day exponential moving average as confirmation.
Alternatively, you can pair CCI with candlestick patterns. Combined with pivot points or trend lines, they can confirm exact tops and bottoms.
Smart CCI strategy
Dessert time! Most traders hate to trade breakouts. They fear that the price is about to reverse, causing losses. Nonetheless, many traders try to catch reversals, e.g. by monitoring the overbought/oversold levels. To do that, they’re using CCI, among other tools. There is a common myth that for a novice trader, hunting reversals will inevitably end up in a loss. Well, if they don’t need the money, let us have it! Listen carefully. If CCI makes a new high above 100, you should go long. If CCI makes a new low below -100, you should go short.
Add CCI (20) on an Н1 chart or higher. Find a high above 100 or a low below -100. If CCI makes a higher high, go long. If CCI makes a lower low, go short. Place your stop loss at the low/high of the signal candle. Make an entry with two orders. For the 1st order, set your take profit at ½ of your stop loss. For the 2nd order, your take profit must equal to your stop loss. If you take profit for the 1st order is activated, you should move your stop loss to breakeven. Do not open a trade if the signal candle is very large and has a long shadow pointing in the direction of your potential entry. If your stop-loss is more than 150 points (for a D1 chart), cut it down by 1.5-2 times without changing your take profit.

Most traders wouldn’t use the above signals to open a trade. Nonetheless, this is a pretty reliable pattern that is profitable 70% of the time. In this case, our profit/loss ratio was 0.75 to 1. You can set any ratio, though. When using this strategy, keep in mind that your stop loss must be short. This strategy aims for a small profit if the trend will continue in the current direction. For the most part, once the pattern has formed, the price starts moving in the predicted direction. So don’t set your stop loss too high.
Conclusion
Now you have another helpful tool at your disposal. The CCI oscillator is very useful to identify cyclical buying and selling points. For better results, you need to accurately identify a time interval and complement CCI with other technical instruments. If you’ve opted for CCI, use an H1 timeframe or higher and start with EUR/USD. My tip is to choose an interval between 9 and 28. CCI works well with MACD which I’ve already covered in one of my previous publications.
I highly recommend that you take a look at the CCI thread on the forum. There you’ll find more than 200 CCI variations, including multi-timeframe, multi-currency, with or without гистограммой, in combination with other indicators, etc. Most modifications are open source so be sure to check them out!


Simply awesome CCI strategy,you are a great teacher sir.I am so much impressed by your tips.Please continue uploading your valuable material
The content in the article are simply wonderful. I express my sincere gratitude for sharing such valuable knowledge at open forum and that to without any charge. Great social service, keep it up !!!!!
oh, thankyou very much, thanks
I am a follower of your methodology, with great success…..I have now added the CCI indicator to my charts, and this does provide greater confirmation of strength…brilliant….
it changes everything. I really appreciate it
The best simplest strategy i have ever seen ! thanks a lot.
What is the driving force behind these indicators?
Good stuff!
I still don’t get how a simple indicator can predict the next market movement, I refuse to understand. The market is very complex