

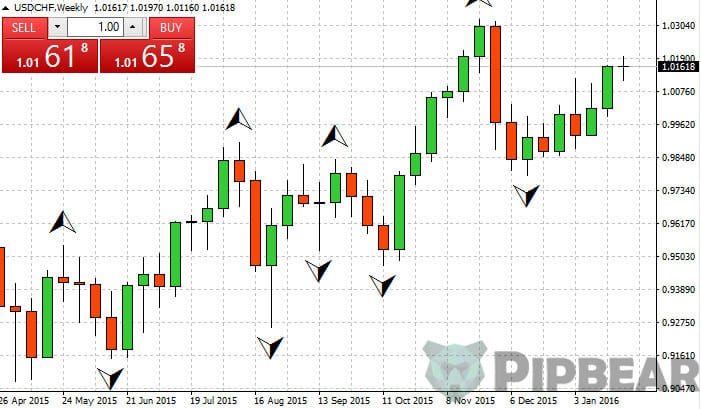
The Fractals Indicator is a classic indicator, which is known as an element of the famous trading system by Bill Williams. The Fractals indicator analyzes price figures formed on the candlestick chart, which shows the reversal points of the market trend. You can apply the Fractals practically on any timeframe. The results are considered more reliable in the long periods. The author advises using this tool to align with the Alligator indicator.
Before reading the article and writing your questions in the comments section, I recommend to watch this video. It’s not long but covers the biggest part of questions on the topic.
Table of Contents
THE FRACTALS INDICATOR
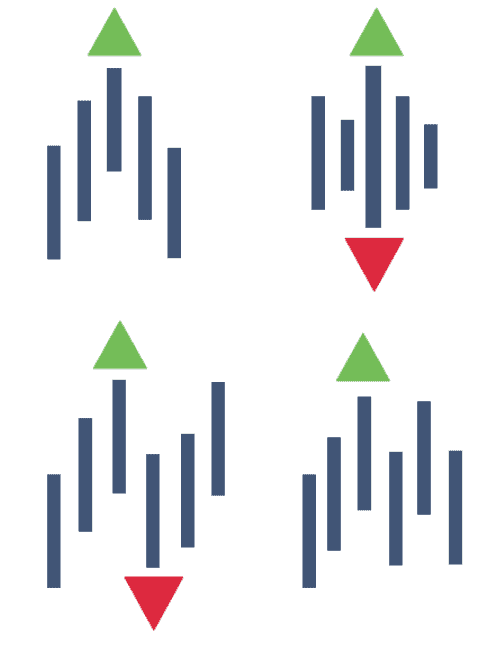
The Fractals Indicator by Williams consists of the candlesticks, the middle candlestick of which is either the highest “Fractals Up” or the lowest “Fractals Down” one. In the former case, two bars are formed first and the second bar is higher than the first one. The level of the third candlestick is even higher but after that, the chart just goes gradually down. This figure is also called a Short Fractals. The Long Fractals is formed the same way but it goes down at the beginning and then rises.
Thus, the user can see the price extreme on the chart over a certain period.
The main thing is that the central bar should be higher/lower than the other ones. Take its value as the Fractals value. If the number of the candlesticks is even, the central bar is considered the later maximum/minimum. The bars can form two figures simultaneously.
Before making a decision based on the Fractals, you should wait until the last candlestick closes.
There is always a risk that the price action may occur during formation, which will result in the creation of the figure out of basic requirements. Only after you’re sure that the Fractals did take place, you can start working with it.
According to the classical strategy, a trader should enter the market when the price breaks out the nearest Fractals. You can trade using the pending orders and trade to the market. Set the pending orders at the distance of one point from the point formed by the indicator. If you trade to the market, the orders should be opened when the price reaches the Fractals and goes beyond it by one or two points. We recommend taking the maximum and minimum shown by the indicator on the chart as the points that form the support and resistance lines. If the price breaks through these levels, it is a signal that you may open a transaction in the direction of the breakout. Therefore, the position traders often use the Fractals in their strategies.
Fractals may be used to determine the market trend vector. One of the simplest and most reliable ways to do it is to analyze the broken figure. It is formed when the Fractals Indicator has time to be formed but the price has already gone beyond its boundaries. If they cross bottom up, you can say state that the uptrend occurs (which means breakout of the buyers). If the price curve goes through the lower boundary, then you see a downtrend (breakout of the sellers).
When the price can’t break through the Fractals, the sideways movement (the flat) is very likely to begin. You just need to wait for the contrary figure to be formed. If the breakout didn’t occur, the flat may appear in the range between the Fractals right after the price goes beyond one of these levels.
This indicator is often used as the tool for creating the resistance/support lines. The value of the Down Fractals is the support level. If the Fractals move upwards, you should consider it the resistance level. The main disadvantage of this method is a large number of lines, which makes you think about choosing the right option.
HOW TO DETERMINE GOOD LEVELS TO PROTECT TRADES
The practicing traders often use this indicator to search for the right place to set Stop Loss orders. Good insurance against losses is an important element of any trading strategy so the traders always need to get reliable and good readings. The Fractals make the trade much easier. Therefore, many traders set the Stop Loss order at the maximum/minimum level displayed by the indicator. Set these orders a few points away from the Fractals to avoid premature activation. The distance depends on the tool and the timeframe. The price often returns to the extremes but keeps moving after that.
The trader should determine the most optimal position to set the safety order on his own.
THE PERFECT TIMEFRAME
The Fractals are more effective while using them on the longer periods.
We don’t recommend using the indicator to determine the support/resistance levels on the charts with a timeframe below H1. If you apply the indicator on the short-term periods, you will only get a large number of extreme points. It won’t help you much though it can confuse you instead. It is practically impossible to determine the best entry point moment.
FOLLOW THE TREND
The indicator displays the pullback movements in the working tool window, which the price makes regularly while following the trend.
While making technical analysis, a trader may easily notice he can create the channel by connecting the points drawn by the Fractals with a line. If the price breaks through at some point in the channel while moving within it, then it is a signal that the current price direction may change. In this case, we advise you to open a transaction in the direction of the breakout.
FALSE SIGNALS
Filtering the Fractals signals on the Forex market is extremely important while trading on the lower timeframes. Use additional indicators to reduce the number of false signals. Many traders use the Alligator indicator to that end. The Fractals is considered completed only if it was formed beyond the Alligator’s mouth.
Advantages of the Fractals:
- It determines and displays the crucial points.
- It helps to determine accurately the support and resistance levels.
- It marks the profitable entry points.
Speaking of the shortcomings, we can only say that it makes lots of false signals when the noticeable trend is completely absent. However, you can easily cope with it by implementing other equally effective indicators.
INSTALLATION THE FRACTALS INDICATOR
You can find the Fractals indicator in the basic set of the MetaTrader 4 trading terminal. If it is absent in your platform, click the link below and download it. You do not need to adjust anything since the value is recalculated automatically based on the specified timeframe. You can select the color of the Up and Down Fractals (by default, red and blue) as well as the thickness of the lines. This is it. The Fractals indicator is installed.
THE FRACTALS INDICATOR & THE ALLIGATOR INDICATOR
The Fractals are often late while generating trading signals. The larger the period, the slower the reaction. Also, the Fractals indicator is considered not very reliable since it produces an excessive number of false signals. If you want to get a real effect, use it in conjunction with other technical analysis tools. The traders most often use the Alligator indicator developed by the same Bill Williams. You can also find this tool in the MT4 terminal.

We should remind you that this indicator displays various combinations of three moving averages:
- The claws (with the period of 13 and shifted by 8 bars forward) are marked with the blue line.
- The teeth (with the period of 8 and shifted by 5 bars forward) are marked with the red line.
- The teeth (with a period of 5 and shifted by 5 bars forward) are marked with the green line.
You can filter the Fractals-generated signals by studying their position relative to the “Alligator’s mouth”. You can skip the Up Fractals under the “teeth” as well as the Down Fractals above them. The traders may set the pending Sell Stop and Buy Stop orders based on the received information. If the Up Fractals are formed above the red line, you should set the Buy Stop order a few points above the central candlestick. If the Down Fractals indicator is formed under the “teeth”, you should set the Sell Stop order a few points below its value. Each newly formed figure cancels the current pending order.
We recommend using the Fractals indicator only together with other technical analysis programs. It also makes sense to use combinations of the Fractals on several timeframes simultaneously. The minus of using the small periods is a large number of false signals. If you increase the gap length, you will get a higher quality signal and the decreased frequency of the signals.
Using the combination of the indicators will allow you to get faster signals on the short periods and check them on the larger ones.


Great explanation on your use of fractals. I’m a new student of your tutorials, which time frame do you use this strategy on? Thank you in advance..
wow i was searching for good fractals methods, you explain so good
Very clear information. Excellent teacher!
thanks for this! now i added this in my tool
Good stuff! Thanks for the effort.
Awesome explanation! does fractal and Ichimoku works with Stock and ETFs or only effective with Forex.
nice tutorial I learned a lot about the Fractal indicator
Great content. Use the ichymoku cloud system along with what you learn from this fractals tutorial and, if you are disciplined, then you won’t go wrong.
thank you very much sir for sharing this, this will help a lot of beginners like myself. thank you so much!