

William Gann is one of the most famous traders of the 20th century. His trading strategy has caused quite a stir among the trading community. Gann seemed to have superhuman intellectual abilities. Let’s start with the key qualities that, according to Gann, make a successful trader. Without these traits, you have little chance to make it in the trading world. First of all, Gann was convinced that a trader must be a perfectionist. A good trader always aspires for a better result and keeps honing their skills.
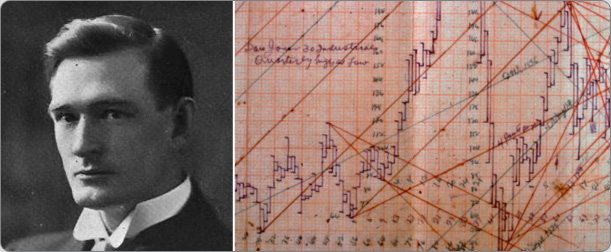
Table of Contents
Gann Theory and method
Gann was a religious man. He revered the Bible considering it the greatest book ever written. He was a 32nd degree Freemason. Gann was proficient in ancient mathematics. Furthermore, he showed great interest in the cultures of Ancient Greece and Ancient Egypt.
In his predicative strategies, Gann used a variety of methods applied in geometry, astronomy, astrology, and ancient mathematics. Plus, Gann authored several books on stock trading. There is no unanimity among experts on the usefulness and relevance of the techniques developed by Gann.
Biography
William Delbert Gann was born to the parents Samuel and Susan on June 6, 1878 in Lufkin, Texas.
Gann came from an impoverished family. The eldest of 8 children, the little William had to walk 7 miles to grammar school every day. Gann never attended college.
At the age of 13, Gann was making a living by selling cigars and newspapers on the trains. At that time, he frequently heard people talking about investments and markets.
Gann wondered whether one can predict the future. He often heard people talking about predicting cotton prices. But was it possible?
In 1903, at the age of 25, Gann came to New York and started to work for a major brokerage company on Wall Street. When World War I broke out, Gann and his family moved from Manhattan to Brooklyn. He predicted Kaiser Wilhelm’s abdication on November 9, 1918 and the end of the war.
Gann started to study the fundamentals of price models and wealth accumulation strategies. His ambition was to find out why market trends tend to repeat at certain times. To solve this mystery, he started to study ancient geometry and astrology. By the same of his death on June 18, 1955, Gann’s fortune amounted to a whopping 50 mln dollars.
Gann was the only financial astrologist of his time. Here is what the Commerce journal wrote about Gann on January 15, 1921: “His calculations are based on scientific works, numbers, and astrology.” According to some reports, Gann used airplanes to predict the harvest. However, it’s highly unlikely as Gann knew exactly what was going on in the market. In his book “The Tunnel Thru The Air”, he forecast an increase in the cotton price to 24.40 USD on September 8, 1927 (page 196).
In his another book, “How To Make Profits In Commodities” he predicted that the stock exchange would close due to a panic selling on October 3, 1931; the market would hit bottom on October 5; the price would trade in the range between 85.51 and 119.15 on November 9, as he predicted in “The Tunnel Thru The Air” on pages 321-323. The book was published on May 9, 1927.
After his death, Gann became a legend in the financial community. His talent to make mind-blowing profits on everything from trading to racing to the Cuban lottery, earned him an almost mystical reputation. His ability to make accurate predictions fascinated people. They said that he once made a bet in the Cuban lottery. Then he flew to Cuba on his plane, with a young woman as a pilot, to receive his winnings before the results were even announced.
Also, Gann predicted the start of World War I in 1914 and the stock market frenzy that followed. In March 1918, he predicted the end of the war and Kaiser Wilhelm’s abdication. Furthermore, he predicted a positive tendency in the market in 1921 and the end of the bullish trend on September 3, 1929. During the 20s and 30s, wheat and cotton prices didn’t change much. In 1935, Gann profited from 83 out of his 98 trades on cotton, grain, and rubber. His percentage of winning trades hovered above 90%. Traders lost all sleep wondering how he achieved such stellar results.
Gann wrote a series of books on trading in which he hinted at the secret of his success. However, the real meaning behind his reflections escapes us. In his works, Gann mentioned the mystical nature of his methods. In his book, “The Magic Word”, Gann talks about “health, happiness, and prosperity achieved through the Magic Word, Jehovah.” He takes his readers through the most mystical sections of the Bible, saying that Jehovah— whom he also calls “the Lost Word” — is the key force guiding us to a better life.
The allusion to Jehovah as “the Lost Word” indicates that Gann belonged to the Royal Arch Masons. Gann was a member of Commonwealth-Stella Lodge No. 409, Free & Accepted Masons, New York City. Nonetheless, his involvement with the masons was not the key to his Wall Street success. Becoming a mason on December 15, 1922, Gann was “promoted” to the rank of Master Mason on March 27, 1923. In 1939, Gann left the Lodge. According to the scholar himself, he made his “biggest discovery” in New York in 1908. Whatever that secret was, Gann discovered it long before joining the Masonic community.
As you can see, Gann had a controversial and odd personality. In this course, we’ll discuss the following tool developed by this extraordinary scholar:
- Gann Line;
- Gann Fan;
- Gann Grid;
- Gann Angles;
- Square of Nine;
- Swing Chart;
- price and time forecast.
This article is dedicated to Gann Line, Gann Fan, and Gann Angles.
To install these tools in Metatrader4, go to: Insert -> Gann-> Angles \ Fan \ Line.
Gann Line
Let’s start with the Gann line which is also called “one to one” (1×1) meaning one change of the price within one unit of time. The Gann line is plotted as a line with an angle of 45°.
According to Gann, this is a long-term trend line that goes upwards or downwards. If the price is above the rising Gann line, there is a bullish trend. If the price is below the falling Gann line, the market is dominated by the bears. If the price crosses the Gann line, there is a reversal is underway. If the price goes down to the rising Gann line, time and price reach a balance. Further intersections of the Gann line signals that the balance has been disrupted.

The Gann line is plotted through two points.
Gann Fan
Now let’s move to the Gann Fan. The Gann fan is plotted at different angles from a major high or low on the price chart. According to Gann, the 1х1 ray is the most important of all. If the price is above the 1×1 line, we’re looking at the bullish market. The price hovering above the 1×1 line is indicative of the bearish market. If the trend is going up, the 1х1 line acts as a strong support line. If the line is broken, this is a reversal signal. Gann outlines nine basic angles, with the 1х1 angle being the most important of them all:
- 1х8 — 82.5 degrees;
- 1х4 — 75 degrees;
- 1х3 — 71.25 degrees;
- 1х2 — 63.75 degrees;
- 1х1 — 45 degrees;
- 2х1 — 26.25 degrees;
- 3х1 — 18.75 degrees;
- 4х1 — 15 degrees;
- 8х1 — 7.5 degrees.

The X and Y axes must have identical scales to ensure that the ratios of price and time increments have corresponding angles (in degrees). This means that a unit of time on the X-axis (hour, day, week, month, etc.) must be the same as on the Y-axis. To make sure your coordinate system is correct, check the slope of the 1×1 line. The slope angle must be 45 degrees.
Gann found out that each of the specified rays can act as a support/resistance level, depending on the direction of a trend. If there is an uptrend, the 1х1 ray usually acts as a powerful support level. If the price drops below the 1х1 line, this is a reversal signal. According to Gann, the price should then drop down to the next trendline (the 2х1 ray). In other words, if one of the Gann Fan rays is broken, the market is about to consolidate around the next ray.
Gann Grid
The last tool for today is the Gann Grid. The Gann Grid is an array of trend lines plotted at the angle of 45°. As you might’ve already guessed, these trend lines are the Gann lines which we’ve covered above. A line sloping at 45°is a long-term trend line that goes upwards or downwards. If the price is above the ascending line, the market is bullish. If the price holds below the descending line, bears are having the upper hand. If the price crosses the Gann Line, a reversal is underway. If there is an uptrend and the price is going down to the trend line, time and price become balanced. If the Gann Line is crossed again, the price-time balance is violated and there is a possibility of a reversal.

To draw the Gann Grid, you need to identify two points that define the size of the cells. If used correctly, the Gann Grid tells the trader where a consolidation will occur.
Bottom line
In this article, we’ve made a good start by learning about three basic Gann tools (Gann Line, Gann Fan, and Gann Grid). Coming next are more complicated trading strategies developed by Gann. Stay tuned for the next lessons!


Onather one month great its 14-4 success ratio wow
it is my first time here, but the way you explained itself I had understood the working concept about gann sir
Thank you sir
Can I use Gann on mobile?
can gann be used for Positional trading as well? can you make a video on that?
it is not applicable everywhere particularly where consolidation occurs and the trend is in change position there it is difficult
This is very helpful… Gann is a very powerful approach
Awesome
I did not get your explanation right…. Can you do a video emphasizing on this topic
do you know how to predict the future price of a stock or a future using Gann Fan? I understand the angles and lines. Say, we need to predict next week’s price of AAPL. I know the 1/1 line. I position it to the recent swing low. Count # of days from the low to the next wk Friday. Which line do I use to predict the price as each line has a different angle? We also won’t know where the price would be by next week. So, do you know how to predict the price using Gann Fan?