

reading The material will describe a universal strategy of moderate complexity, the time frame of this system is 4H, and it uses any currency pairs. Trading on H4 Fibonacci is based on two sliding with certain settings and an oscillator RSI, plus the addition of the construction of Fibonacci levels.
Before reading the article and writing your questions in the comments section, I recommend to watch this video. It’s not long but covers the biggest part of questions on the topic.
A set of such “assistants” with certain settings allows you to get a large percentage of successful transactions, and the algorithm for their use is quite simple.
Indicator settings
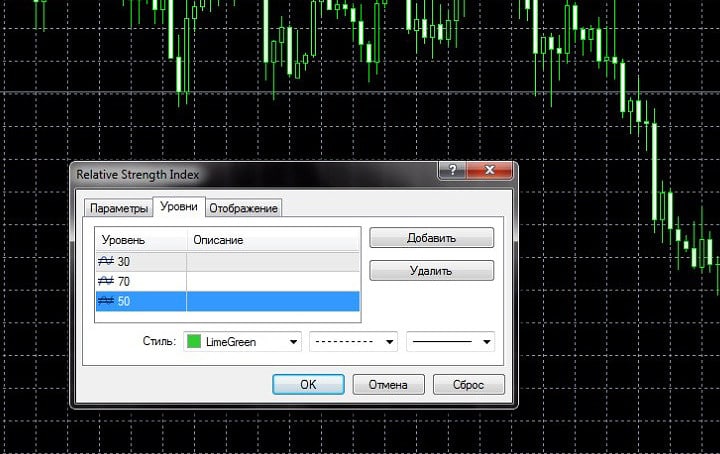
- The standard indicator RSI (Relative Strength Index) about oscillators should be set on the schedule of the required asset. The RSI period is set to 14 – it is usually set by default, plus an additional layer 50 is added in the Levels tab of the indicator setting window, in the screenshot, the level style is set in bright green for better readability:
Next on the graph are an exponential moving average (EMA) with a period of 100 and a simple moving average (SMA) with a period of 150. At first we set the green color, and red for the second. They will give the main signals to this trading system.

Further, we extend the Fibonacci levels according to all the rules – we make the line of construction from the maximum to the minimum (or from the minimum to the maximum, depending on where the movement is expected), while it is better to switch to a linear graph for greater accuracy: At that, the preparatory stage for trade can be considered complete.

Signals of the trading system
H4 Fibonacci Method In this trading strategy there is an interesting point: signals from RSI will need to be tracked on the chart with a time frame in 1 day, and the main work will be conducted on the 4H chart. RSI with a period of 14 gives very simple commands: when its line on the included scale D1 slipped an additional mark of 50 from the bottom up, then we conduct transactions solely for purchase.
When the RSI moves down and has crossed the 50 mark in this direction – for sale only.
When the 4H green moving average crosses the red from the top down (as in the screenshot above), you can enter into long-term deals for sale. If the green line crosses the red from the bottom up, then it means a long bullish trend. Fibonacci levels are used in this case to determine the best moments for entering the market and reduce the risks of the trader.
Let’s suppose that while preparing to work on this strategy and setting all the required indicators, you become a witness, as the green sliding crossed the red line. This situation is indicated by a red circle in the screenshot below:

To understand whether this crossing is a reliable signal for a sale, it is necessary to move from a four-hour chart to a daily one, and look at the RSI’s indicators:

The RSI line is below the level of 50, which means that the signal for sale is confirmed, it remains to find the best moment for it. Here the Fibonacci levels come into play: we must go back to the four-hour chart, make it linear, and stretch the levels from the previous trend from right to left so that level 0 is at the top:

When a signal from 2 sliders comes in and is confirmed by the RSI, the nearest Fibonacci level from the price chart is 100,00. So, the transaction should be opened at the moment when the schedule breaks – so we saddle the market trend, and we will move after it. The last screenshot shows the moment when the price finally broke through the hundredth level, which was the final signal for the deal for sale, and it allowed to get a good profit.

Exit from the market is carried out by two methods:
- If you see that the price chart starts to slip when it reaches the lower level, in our case it was 261,8.
- The exit is made when the moving averages intersect again, and the green line appears over the red. So there is more chance of getting a solid profit on the market, but the risk of untimely exit is also higher.
Results
Even though three indicators are used in this trading system, it is quite simple and intuitive. After crossing the middle lines, the RSI is checked on the highest scale of the chart and entry into the market occurs after the penetration at the price of the nearest Fibonacci level.
Since the trade is conducted on a four-hour time frame, the H4 Fibonacci strategy operator makes transactions relatively rarely, but it does not practically have false signals. Such a trading system can be recommended for traders who have accumulated a certain experience in the financial market, for which the main thing is not the excitement and number of deals, but profitability and the absence of risk.


Great content Coach – thank you for sharing your extensive knowledge. I have never tried trading the higher time frames as I always think the stops have to be too big.
Thanks , much appreciation for a very informative video. Blessings and gratitude!
just wanted to say thank you for putting these informative videos together, really good. I will be re-watching this very soon.
fantastic mate, actually some decent content here
Thank you coach
Trading higher time frames is the first step to successful trading
You are impacting how very many people trade online. Thanks
Do you give signals coach?
That is some pretty solid content Coach, thanks. I’m a complete noob in forex and have been looking for a strategy to trade H4 timeframe for some time now. All the systems and indicators I have used have failed me. I’m going to try this one out. I will give feedback after some time, Wish me luck.