

The Linear Regression Indicator (LRI), developed by Hilbert Ruff in 1991, is an effective and easy-to-use tool which helps to predict future prices before they become overheated. The linear regression indicator is displayed on the chart in the channel form which forms two parallel lines equidistant from the trend. The width of this corridor depends on the selected timeframe only. The indicator can be used when working with almost any assets, starting from currency pairs and ending with precious metals.
Before reading the article and writing your questions in the comments section, I recommend to watch this video. It’s not long but covers the biggest part of questions on the topic.
LRI settings and parameters
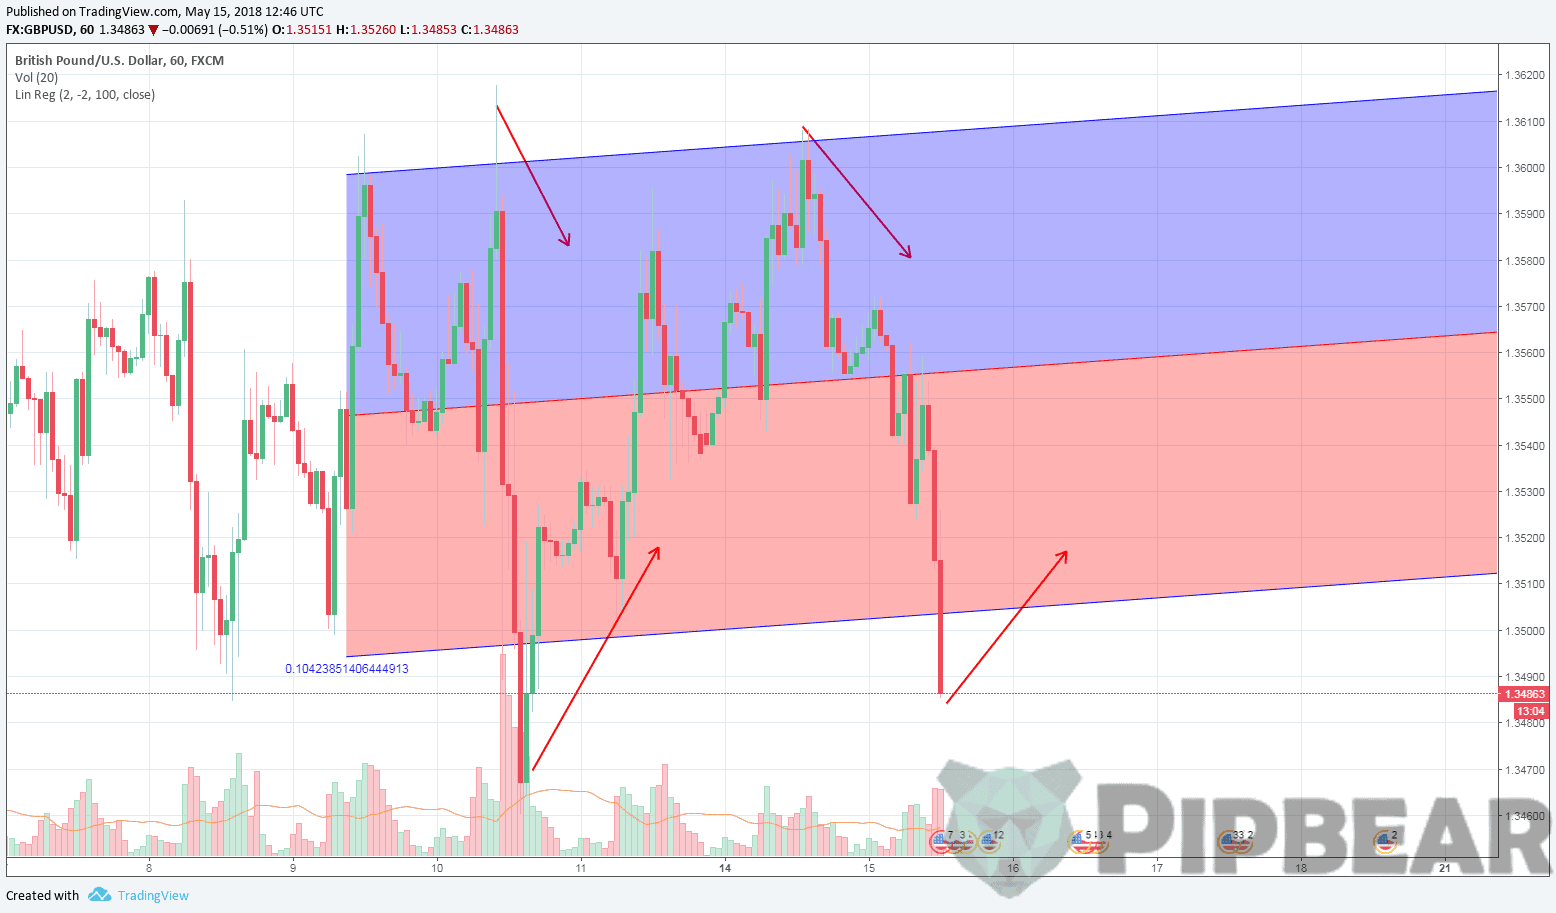
An ordinary channel, built by the linear regression indicator, usually looks this way (Picture 1). Depending on the situation, its boundaries can be lines of either resistance or support.
It’s necessary to make the appropriate settings to create channels that fully meet your requirements. This procedure’s simplicity allows performing it in a matter of minutes.
The main parameter which you will need to specify to the trader is the channel width. It’s located in the Fixed Date Time tab in MT4. The user will need to set a working date based on the terms of the timeframe he sets. For example, if we are talking about working on hourly segments, it will be enough to have data per day.
The remaining settings perform a predominantly decorative function. Their main task is to make the visual perception of the chart as convenient as possible for the trader. We set the price and channel colors while using the Stop Color and Trend Line Color tabs.
It’s also possible to set the desired thickness for the extreme lines by changing the settings in LR WIDTH item. This completes the channel construction procedure.
The indicator calculation formula:
![]()
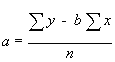

- x is the current period
- n is the total periods number
The way to use the linear regression indicator
- There are two main strategies for working with the linear regression indicator:
- for a turn;
- for a breakdown.
In the first case, the trader is guided by the price changes dynamics within the channel’s boundaries. When approaching it to the resistance or support line, the bet is made for it will go in the opposite direction.
If/when the price closely approached the upper limit, it’s possible to get rid of the asset. If it is at the very bottom of the channel, it makes sense to think about making a purchase. In the case of binary options, PUT is acquired at the top (the downgrade forecast is a DOWN option), at the bottom — CALL (the forecast of the exchange growth is an option UP) – Picture 2.

The strategy for the breakdown involves the use of the order which is set outside the borders in a not too far from the distance. Given that the violation of the border by the price sometimes is short-term, it is also better to be safe by setting a stop-loss. And, of course, regardless of the chosen strategy, it is important to assess the situation on the market as coolly as possible.
Conclusions
The linear regression indicator is a convenient auxiliary tool that greatly facilitates the modern trader’s work. It can be used almost on any schedule and not in the singular only. Professionals often use complex modifications, which allow changing the settings more flexibly, by the users’ wish. For beginners, it makes sense to pre-practice on the classic indicator’s versions while evaluating its capabilities when trading on demo accounts.


