

Let’s face it: many of us are looking for “the very same grail.” Each time, downloading this or that indicator or strategy, we have a small hope: “but what if ?” If you recall the “Alchemist” by Coelho, then wealth is often worth looking under your nose. In our case – right in the trading terminal.
Before reading the article and writing your questions in the comments section, I recommend to watch this video. It’s not long but covers the biggest part of questions on the topic.
Today we will talk about the classic MACD indicator: we will analyze its design, we will reveal the basic tactics of application, including the little known, and we will try to understand what is the secret of longevity (and it is almost 40 years) of this tool.
Everyone knows that there are trending indicators, designed, to work in a trend, but there are oscillators that work best in the flat. The indicator, which we will talk about today, is the MACD trend oscillator. The full name is the Moving Average Convergence/Divergence Trading Method, it is pronounced as “MACD”, and has nothing in common with McDonald’s.
Table of Contents
Characteristics of the indicator
- Platform: any
- Currency pairs: any
- Timeframe: any, preferably above H1
- Trade time: round the clock
- Type of indicator: classic trend oscillator
History
The MACD indicator shows us exactly what is said in its name: to what extent the moving averages have converged or dispersed on the chart. This indicator was developed by the well-known New York trader Gerald Appel in 1979 to analyze the stock market, and then, as often happens, migrated to other financial markets, including Forex.
The main reason for such popularity of the MACD indicator is that it does provide a lot of useful information about the market while combining the properties of both the trend indicator and the oscillator. The author of the indicator, Gerald Appel, is also the author of several books, such as “Winning Marker System: 83 ways to beat the market”, “Stock market trading systems “,” New directions in technical analysis” and others, and also issued his own newsletter “Systems and Forecasts”.
Calculation of MACD indicator
The MACD indicator uses as many as three moving averages in the calculations, although on the chart we see only two: the value of the long moving average is deducted from the value of the shorter one, and then the difference is once again smoothed out. Why so much smoothing? Why do you need to smooth anything at all?
The answer is obvious – just look at the price charts. Sometimes “you can’t see the forest for the trees” and, especially when prices are jerky from a lot of news, it’s difficult to trace the true trend, to understand where the price is still moving. Smoothing removes all these jerks and deceptive maneuvers, leaving only a general direction from prices. Well, the pay for smoothing is lagging signals. With trend trading it is even good: all the false movements and noises are eliminated; but with scalping, of course, it is unacceptable: while you are going to enter it the time of release will come. So, when building the MACD indicator, there is already double smoothing, which guarantees the following: since MACD went down, then the trend changes.
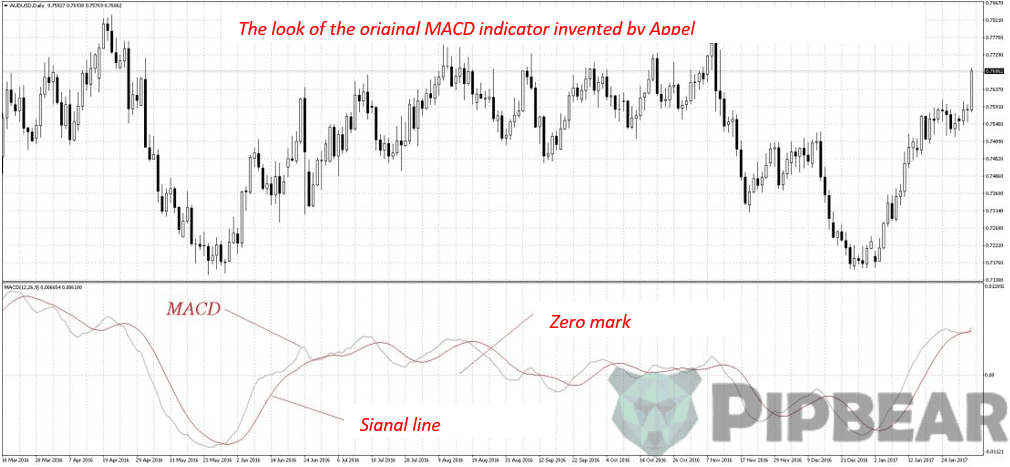
The MACD indicator is drawn “in the basement” of the terminal, like all oscillators. The original indicator proposed by the author looked like two moving averages, the intersection of which gave signals to action:
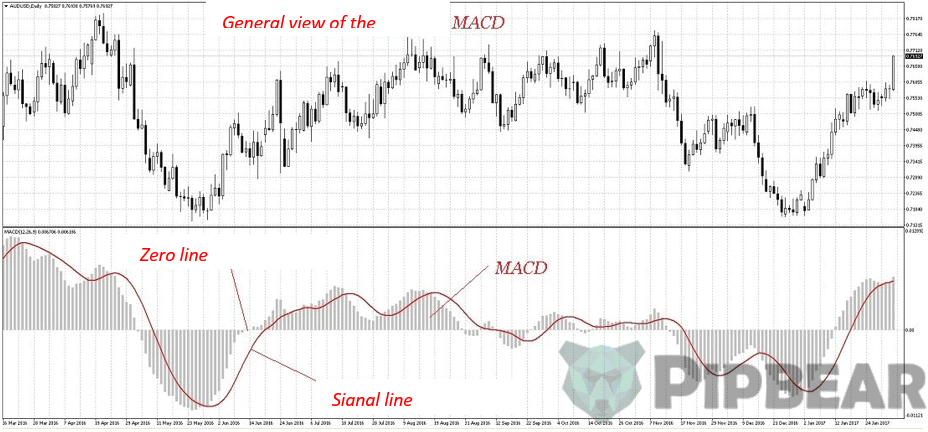
Subsequently, one of the lines began to be depicted in the form of a histogram (strips or columns oscillating around the zero line). It is the modern look of the MACD indicator that you see in the terminal:
So, the MACD simply calculates the difference between fast and slow-moving averages. When the MACD is above zero, this indicates that the fast-moving average is higher than the slow one. When below zero, it means the fast is below the slow. Accordingly, the growth of the MACD indicates an increasing bullish trend, the fall is bearish.
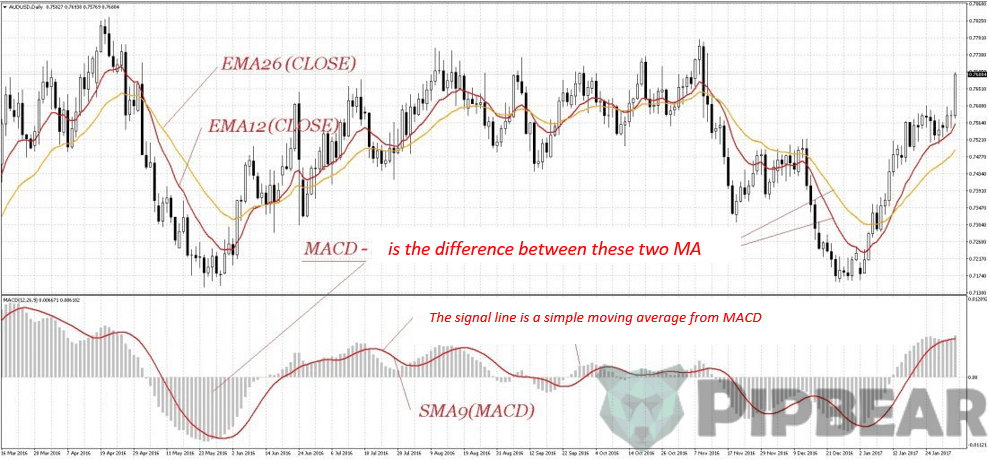
Well, now let’s take a look at the MACD calculation formula. First of all, we need to prepare two exponential moving averages: long and short, and then find their difference:
MACD=EMA(CLOSE,PL)-EMA(CLOSE,PS), where
- EMA – exponential moving average;
- PL and PS – long and short periods of the exponential moving average;
This is the line that you see in the modern version of the MACD indicator as a histogram. It is called the fast MACD line since it was still a line.
The next step is to calculate the signal line as a simple moving average from the difference of two exponential moving averages calculated above:
Signal=SMA(MACD,Pa), where
- SMA – simple moving average;
- Pa – a period of the signal line of the indicator.
So that is how we get the red line on the chart. It is called a slow MACD line or a signal line.
MACD Histogram = MACD – Signal: The so-called MACD histogram is also often mentioned. This is not the same as the MACD indicator itself. The histogram is the difference between the MACD value and the signal line, that is:
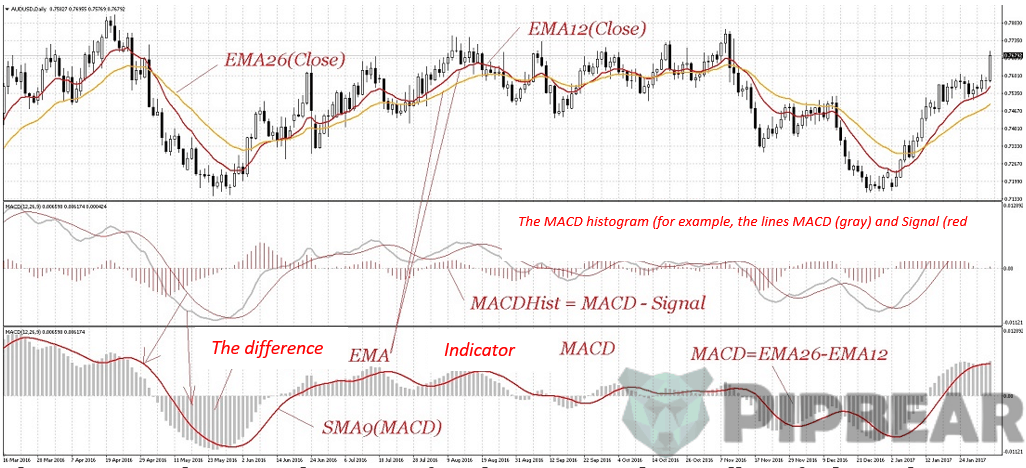
I have not met the MACD histogram for a long time, and you will not find it in the terminal. But if you suddenly find somewhere in the literature on the technical analysis of a MACD histogram, then you will no longer confuse it with the MACD indicator.
Settings
There are four parameters of the indicator: the period of the slow-moving average, the period of the fast-moving average, the period of the signal moving average and the price for the calculation.
As a rule, the periods of 12, 26 and 9 are taken, and the price for calculations is the closing of the candlestick. It is precisely these periods (12 and 26) that Appel himself recommended for those who wish to sell. For buyers, the author recommended using 8 and 17. But it concerned the stock market, and for other markets, you can safely use standard periods or pick up your own.
How to use
The MACD indicator is most effective in markets with a wide range of fluctuations. The perfect trading on the indicator comes out in the presence of a clear trend. In this narrow range, it will generate much less false signals than other trend indicators.
Intersections

As I have said before, the moving average smoothes out the impact of random price fluctuations. The difference between the two moving averages, even more, smoothens the price. In the end, this leads to the fact that MACD generates fewer false signals, but it is decently delayed. Nevertheless, the MACD in the narrow range behaves much better than just crossing of two moving averages.
When this type of signal is used, long trades are made when the MACD histogram crosses the signal line from the bottom up. For sales, the opposite is true. This type of signal is well taken when there is a good trend. For example, a bearish trend is included in sales when the MACD indicator crosses the signal line from top to bottom, and the exit from the transaction occurs at the back intersection.
That is, opening a trade occurs often just at the end of the rollback against the trend, and then exit at the signs of its start. The picture above shows an example of a trade at the intersection of the MACD and the signal line. The trend is determined by the classic rules: we have a local maximum and a local minimum. When the new local maximum appeared lower than the previous one, there was an opportunity to change the trend.
When the level of the previous low was breached, it could be assumed that a new bearish trend would appear, and you could start waiting for signals to sell on the MACD indicator. Before the high-low order was broken (the new high eventually turned out to be higher than the previous one, which signals of a possible change or end of the trend), we made 4 deals, three of which ended in a decent profit and one small loss.
Oscillator

What is the logic of this indicator? MACD is the difference between two moving averages, fast and slow. The fast-moving average characterizes the short-term trend, and the slow one characterizes the longer-term trend. The greater the discrepancy between these moving averages (the higher or lower the MACD histogram), the more bullish or bearish the market is. There is such a thing as a reversal to the average.
So, price fluctuations always return to their average price. In the case of the MACD indicator, price fluctuations (slightly smoothed out) are a fast-moving average, and the average price itself is a slow one. Accordingly, the fast average always returns to the slow one, and the difference between these moving averages always returns to zero. At the same time, the further the middle diverge, the higher the histogram rises or falls, the greater the probability that the convergence is about to begin, that is, the histogram movement will turn in the direction of zero.
Therefore, the next type of signal from this indicator is the appearance of maximum and minimum, which are used in the same way as in the case of other oscillators. The only point is that MACD does not have pre-determined overbought and oversold levels. The analysis is done with the naked eye. In the picture above, I visually determined the level of 0,0085 and plotted it on the chart.
As can be seen, the intersection of the overbought/oversold level in the opposite direction often serves as a pivot point for the price, well, or at least the beginning of the correction. This does not always work with great accuracy, as, for example, when working with the upper level in the picture, but this signal is much more reliable than many other oscillators. And in combination with the levels of accuracy or when working on a trend, the accuracy increases by multiple times.

The picture above clearly shows a good uptrend. The entrance to the purchase is made when the indicator MACD indicator of a certain level, and the exit from the transaction – with a simple intersection of the indicator with its signal line. Using pending orders will make the entries even more accurate. The meaning here is that by raising the level above the zero line, we simply filter out insignificant price flops. Our level is pierced only by really strong movements, which we take.By the way, in the presence of a trend, you can use the following trick, based on the delay of slow oscillators. I have already told you about it in the article about Stochastic Oscillator. The point is that after the breakdown of the level of overbought/oversold in the case of trend movement, the price can continue to move in the same direction for a long time, and the oscillator can dangle behind the levels.
Position relative to the zero line

In the presence of a directed trend, it is very good to enter into it directly on the peaks and valleys. But what if the direction of the trend is unclear, but the movements are very volatile, in a wide range? Just need to take into account the position of the indicator relative to the zero line.
In the picture above, signals for sale are taken at the intersection of the MACD and the signal line above the zero level, and the purchase is lower. That is we have combined the two approaches listed above: the use of MACD as an indicator and the use of intersections.
If you take all the signals by these rules, as in the picture above, then you can earn a decent number of points on such broad ranges. In the first trade there were sales, in the second closing of long and, since we were below the zero line, the opening of short. At the third point, closing long and re-opening short. And such simple trading would bring us 16 trades, two of which would close to about zero, and the rest would bring a profit of about 4,500 old points.

You can go even further and apply a couple of levels above and below zero on the MACD chart to filter out minor fluctuations. In this case, you can take only those transactions, when a signal appears to which MACD pre-punched these levels. That is, the intersections occurred above or below these levels or next to them. In this case, we will use the oscillator properties of MACD even more completely.
In general, the most effective use of MACD is in such conditions is when the market is not in a certain trend, and the swing range is large enough.
Divergences
As it is required from all oscillators, the strongest signal MACD is a divergence. An article has already been written in the blog on the types of divergence and methods for determining it, so we will not repeat it. I will only say that the divergence from the MACD indicator is the most accurate in comparison with other oscillators.
Determination of further short-term trend on the bars of the histogram
So, by the columns of the histogram, you can determine the continuation of the current short-term trend and even build a simple trading system on this indicator property.

Very often, when a new peak appears, immediately after the MACD indicator crosses the zero mark, another higher peak appears. As a rule, after the breakdown of the first peak, the price continues to move or immediately unfolds. If you place pending orders over the first candlestick on which the MACD indicator broke its previous high, you can get a fully profitable trading system.
Figures of technical analysis

On closer examination of the histogram, drawn by the MACD indicator, you can see that the figures on it work quite well.
The picture above clearly shows that using the principle described in the previous paragraph, you can also successfully trade classic figures, such as the head and shoulders, double bottom. The figure above shows the double bottom of the MACD indicator. In the breakdown of the right shoulder, you can set a pending order (long in this case) and enter at the very beginning of the new movement.
Shared use with other indicators
Shared use of indicators is always a good idea. Each indicator has its strengths and weaknesses. The computer will allow you to build as many indicators on your price chart as you want. Try to combine them. Oscillators work particularly well in the environment of a troubled market and at important turning points when the trend loses momentum. During a strong trend in the market, oscillators can do more harm than help.
Signals generated by stochastic lines appear too often and are unreliable when using only a stochastic. MACD intersections are less frequent and more reliable (although usually slower). The way to increase the value of both indicators is to combine them. Why, for example, not to use the characteristics of following the trend of the MACD system as a stochastic filter? In other words, follow the buy signals at the stochastic intersections only when the MACD lines have a positive projection.
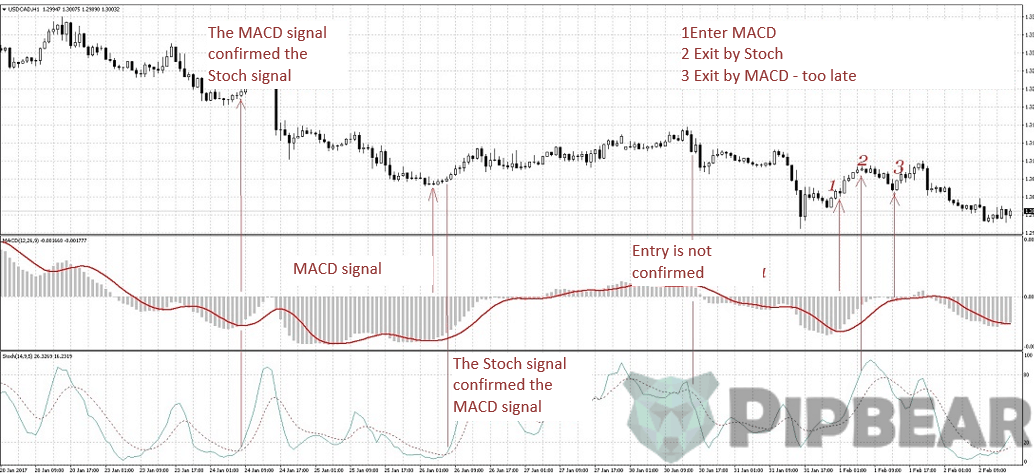
And you can also use the weekly histogram MACD as a filter for the daily signals of the stochastic. You will use long signals on the daily stochastic chart to enter the buying side only when the weekly MACD histogram has a positive value or is rising. In such a bullish environment, you should better ignore the short-term signals of selling a more sensitive stochastic system.
Advantages of MACD
One of the main advantages of MACD is that it includes elements of both momentum and trend in one indicator. As the indicator following the trend, it will not give too much false information for too long. The use of moving averages ensures that the indicator will follow the movements of the market instrument. Using exponential moving averages instead of simple moving averages, it became possible to reduce the delay.
Divergences in MACD can be key factors in forecasting trend changes. Negative divergences signal that the bullish impulse is declining, and it is possible to change the trend from bullish to bearish. This can serve as a warning signal for traders to fix part of the profit in long positions or for aggressive traders to consider opening short positions.
Disadvantages of MACD
One of the advantages of MACD can also be a drawback. Moving averages, be they simple, exponential or weighted, are lagging indicators. Even though the MACD represents the difference between the two moving averages, there can still be some delay in the indicator itself.
MACD is not particularly good for determining overbought and oversold levels. Although it is possible to determine levels that historically represent overbought and oversold, the MACD does not have any upper or lower limits limiting its movements. MACD can continue to move beyond historical extremes.
MACD calculates the absolute, not relative, difference between the two moving averages. It is calculated by subtracting one moving average from the other. If the market instrument increases in price, then the difference (both positive and negative) between the two moving averages will increase. Therefore, it is difficult to compare MACD levels over a long period, especially for tools that grew exponentially.
Conclusion
Because the indicator MACD has both the properties of the trend indicator and the properties of the oscillator, its use in trading can be very flexible. A huge number of trading systems use this remarkable indicator to generate signals. Nevertheless, like most indicators, using its signals for trading without additional filtering is extremely dangerous and can lead to a discharge of the account. This is another great tool in the trader’s piggy bank and it depends on you how to use it. Use the indicators wisely, analyze and weigh your decisions, and success will certainly always accompany you.


Thumbs up for sure. Fantastic video. You really explained that well.
your explain is very clear & “short”. may i know this MACD is suitable for stock only or it is also suitable for others? example: crude oil, soya bean (commodity ) ?
Finally I understand what MACD it mean… it is very bad to use a indicator and not to know what does it mean and what it does
if you’d been my teacher in school I’d have done a lot better. thanks.
I love using the MACD indicator as well. Especially for spotting bullish divergences!
Thank you for the time you put into this, it helped me a lot
Thank you for the time you put into this, it helped me a lot
Thanks a lot for the information , very comprehensive!
After watching about 4-5 videos on MACD and only getting confused, I understood now sir. Thanks for the great explanation. You’re the best.
Thanks a lot for your best explaination