

Candlesticks on the chart sometimes give an incorrect picture of what is happening. Too often we do not see the forest for the trees because of unimportant price movements.
Before reading the article and writing your questions in the comments section, I recommend to watch this video. It’s not long but covers the biggest part of questions on the topic.
But what if you could see the most important price values, separate the true value from speculation? See the real trend, without unnecessary maneuvers which distract attention? Today, we will get acquainted with such a method invented many years ago on the Chicago Stock Exchange, meet the Market Profile.
Table of Contents
Normal distribution
Before we proceed to the definition of the market profile, we should mention the “normal distribution“, on which the whole idea is based.
Normal distribution is a probability distribution which plays a crucial role in many areas of knowledge, especially in physics. This phenomenon takes place in the Forex market.
The examples of normal distribution in our life can be attributed to such phenomenon as the deviation in the shooting or the measurement of different values, the height of a person, and, of course, the normal distribution takes place in the Forex market.
A defining characteristic of the normal distribution is that 68% of all its observations lie in the range of plus or minus one standard deviation from the average control value.
This distance is noted in the picture above.
This is the most valuable data. In our case, these are the places where the price was most often traded within a day.
The range plus minus two standard deviations contains 95% of the values of the normal distribution. All other data is not that important.
How can this information be useful to us in trading?
To apply a normal distribution on the market, we need to focus only on value, that is, plus or minus one standard deviation of all price values of the day; we will not pay attention to all other prices.
Besides, we should take the most important control price of the day, which is in the figure above in the middle. But I would like to note up front that on the trading days it will not necessarily be in the middle.
This is how the market profile looks on the chart:

This method is based on the principle of the normal distribution, and it first appeared on the Chicago Stock Exchange. The market profile defines a Value Area, namely, where the price was 70% of the time during one day.
This method of market analysis is suitable for short-term trading, and you can trade both within the day and during 2-3 days. Longer-term signals will need to be sought based on some additional factors.
The market profile allows us to find 2 price points, the area between which we can call a zone of value, and we can separate unnecessary noise with its help.
By value area we can call an area that has a real priority on the price chart. As you can see, we use a special indicator. The reference to it is at the end of the article.
There are a lot of such indicators for displaying the market profile in MT4. They differ in visual trivia and additional functions, but from a practical point of view they are all the same.
The place where the price was most traded within a day, in other words – the value area, can be measured with the naked eye, but with the help of an indicator it is much easier to do. There is nothing magical about the market profile, and I’m sure that everyone will be able to understand this trading instrument.
The indicator which I am citing in this article is called: riv_ay-TPOChart. It is installed on the chart as usual by the standard instructions which are on our website.
If this indicator does not suit you for some reason, you can simply put TPOChart in the search engine, and you will find a lot of similar indicators.
The timeframe usually used for the market profile is M30, but you can analyze M30, and open positions on any other timeframe which is customary for your trading.
Let’s take a closer look at the chart with the indicator:

We see different letters on it. They mean one candlestick or one price bar.
If we put a ruler, we can see that one row of letters coincides with one candlestick:
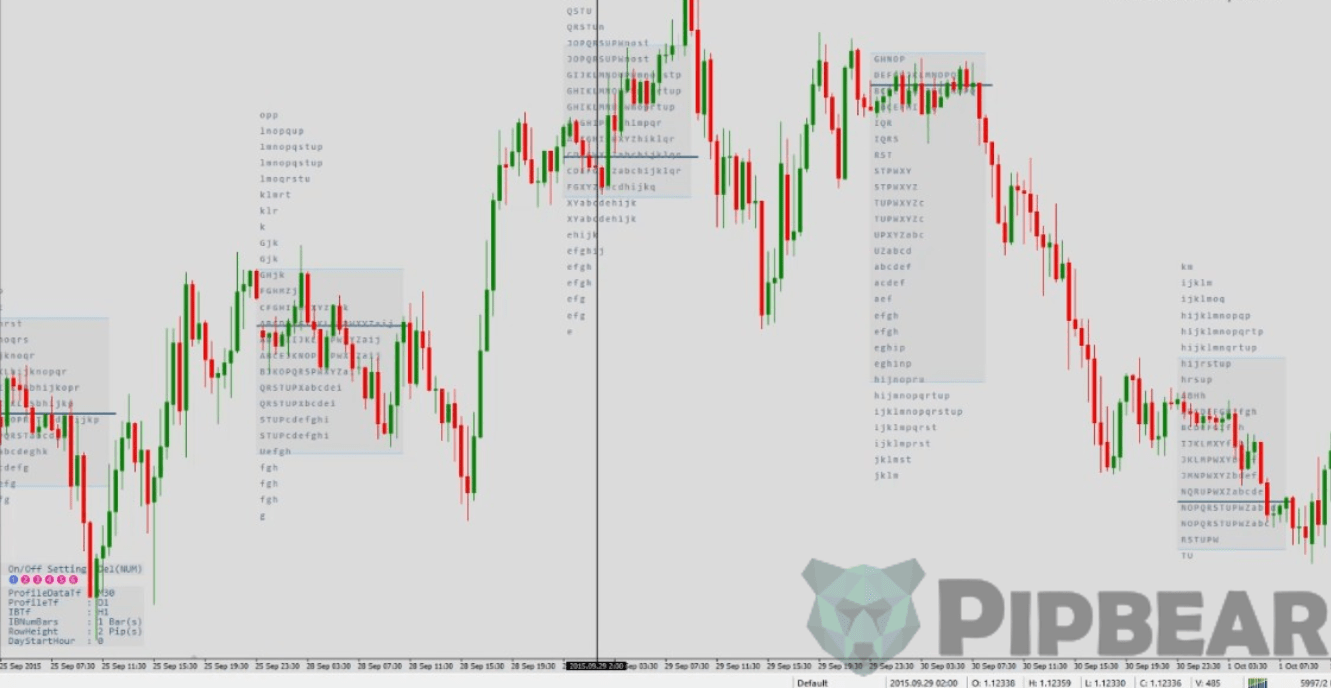
If the indicator shows only one letter, then in this area there was only one candlestick on that day.
This way, the distribution of letters on the market profile takes place.
If you change the indicator settings, these letters will be painted in different colors depending on the trading session on which the letter has appeared:

Also in the settings, you can turn off the display of letters, replacing them with squares:

All these are simple visual settings of the indicator. Someone finds it more convenient to look at the letters, as in the classic version, and someone is more comfortable with squares, as a more demonstrative option.
Further, on the chart we can observe the middle lines.

This is the Point Of Control which is the most important price for a given day, or the place where the price spent the greatest amount of time.
Under the normal distribution, there is a value of about 70% of the data is valuable for us, or a zone in which the price spent 70% of its time within the day. This particular value area is highlighted by a gray square. All the rest is the price noise, to which we draw much less of our attention.
- The middle line is the point of control.
- The area highlighted by the gray square is the value area.
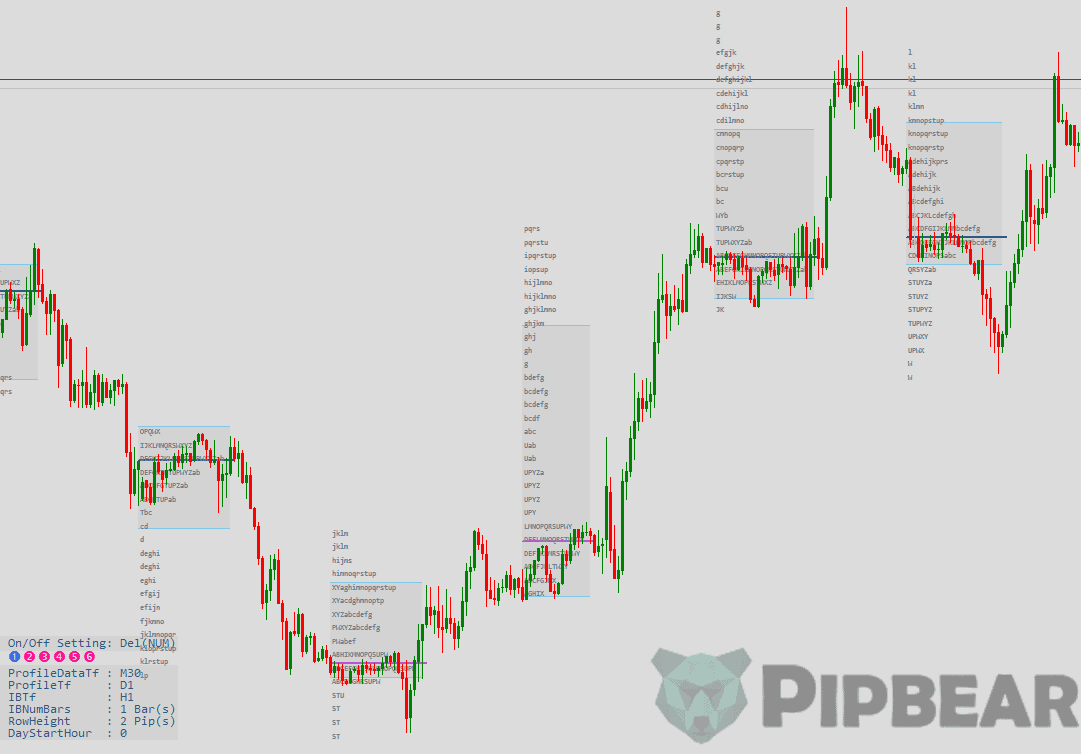
- And those areas where we have one or two letters is the area of low resistance.
These are the blanks, like the GAPs, which tend to close:

Everything that does not enter into the gray box is called the area of rejection, these are the places where the price did not stay on that day.
How is the Market Profile applied in practice?
Now let’s figure out how to apply the market profile in practice.
First of all, it is worth noting that the market profile provides an opportunity to see the true trend in the movement of value areas. If the price does not return to the field of the previous days, then there is a strong and clearly defined trend.
If the value areas overlap each other, then we can say that there is no clear trend at the moment.

The blanks in poorly traded areas, areas where only one letter is located, as well as GAPs, are closed.
If there is no trend, then, most likely, one letter will close at the end of the day, or within 1-2 days. At this point, the market is trying to restore balance. Therefore, it is possible to develop tactics aimed at working with this moment of the market profile.
If you see one letter and do not observe a clearly defined trend, then you can expect that this letter will close in the opposite movement.
The boundaries of value areas are often used as support and resistance levels built based on the market profile. Typically, this tactic is used when there are fluctuations of the value areas within the range formed after a strong movement.

In simpler terms, the value areas overlap each other, and the strongest price movement plays the role of the mother candle.
In general, we observe the inside bar pattern, while the outside bar is highlighted by a more extended value area, and the next two candlesticks are inside it.
You can work on a breakdown or a rebound from the value areas. The technique is the same as when working with Price Action when trading on the breakdown and release levels. The only difference is that we define levels by the boundaries of the value areas of the mother candles:

Also, the boundaries of the value areas can be used for exhibiting stop-loss.
If we were considering some positions for sale, it would be logical to set a stop-loss just above the upper-value range:

In my opinion, one of the most valuable applications of the market profile is trading in flat, or, rather, an understanding of when the flat has ended.
Let’s imagine that there are several days when there is a flat. Supposed that the designated day has not come yet:

We can build the boundaries of this section by the value areas. Not by the tails of candlesticks, but by the value areas.
Remember that technical analysis is an art, not an exact science, so we put values approximately to form a picture of what is happening:

We may work for breakdown within these borders. When the breakdown occurs, we understand that, in general, the flat is over, and we can make money on it.
I would like to add that such an application of the market profile justifies itself.
Indicator for building a Market Profile in MT4
There are quite a lot of indicators for Metatrader 4, designed to build the Market Profile, but due to constant updates of the terminal, most of the indicators at the moment does not work. I suggest using the riv_ay-TPOChart.v102-6 indicator. It has a lot of options and, most importantly, is compatible with the latest MT4 builds.
Installation in the terminal is performed according to the standard instructions. Timeframe – M30
Description of indicator settings
- LookBack – the number of days based on which the profile will be built
- ShiftBrokerofGMT – time shift of the broker from the GMT. This setting is responsible for from which hour to build a profile
- ShowPriceProfile – whether to show the price profile
- ShowFromStartPeriod – do not change this setting, otherwise, the display will fail
- ModeLetter – on/off the display of the profile in the form of letters
- ModePseudoLetter – on/off the display of the profile in the form of squares
- ShowColorBySession – on/off coloring according to trading sessions
- ShowProfileInfo – on/off display of additional information: boundaries, extent, etc.
- ShowPoc_AsLineSupRes – on/off display of the target price of the day as a support/resistance line
- ShowPocInfo – on/off the display of information on control points (prices) on the right on the chart
- ShowCurrentTVPO – to show the current market profile data and volumes traded at price levels
- ShowVAHL_Lines – on/off the display of the boundaries of the value area in the form of lines
- UseVaHL_AsLineSupRes – whether to build support levels of resistance based on the boundaries of the value area
- ShowOHLCbar – showing the current daylight to the left of the profile
- BarH4asThinkorswim – showing H4 candlestick with a time interval as in the ThinkOrSwim platform
- ShowIB – on/off the display of the Initial Balance; we will discuss this in the subsequent lessons
- ShowDIB – on/off the display of the Double Initial Balance
- UseTruePoint – do not touch this setting, it was used for previous versions of the indicator
The remaining settings are responsible for displaying the indicator and nuances in the specifications of the symbols, if you have everything displayed properly, they should not be touched.
Conclusion
The market profile is quite a multi-faceted tool. In this review we have only got acquainted with the basics. We will consider more in-depth trading tactics and strategies in the future lessons, follow the updates of our site.


Market profile is the best method i know on analysis, and with PA fibo confluence i s it enough to be profitable in long term.
great method of getting pips. wish I had the market profile indicator. I have one similar to it but it doesn’t do H1 time frame
please advice where is the link for the MP indicator. Thanks very much
Hi Where download this indicator please? And do you know where find this for mt5 and volume profile??
I used to hate indicators, I’ve being trading for a couple of years without them, I love price action, but now I realize that I was wrong about it, of course if you have no idea of priceaction, using indicators is useless, but onece you understand price action, this type of indicators based on price are really good as confirmation entries, my english is really bad, hope you understand my mess
I have been doing extremely well with this.Hope it helps!
Amazing .It really is, in my opinion the best way to make money online. And best of all, like I already said, it really works, incredibly well in fact.Everything you’ll need to know is right here
MP with support and resistance works great. Divergence is a bonus. Will try this out on my next trade.
Thank you coach
I use TradingView, I’ve had the Volume Profile Indicator for a long time. And, it’s free.