

MFI – Market Facilitation Index indicator is a convenient indicator that evaluates the current market trend. Measurement is carried out on the price and volume changes comparison basis for a certain time interval. Bill Williams, the legendary trader is the of this tool which was described in his book “Trading Chaos“.
Before reading the article and writing your questions in the comments section, I recommend to watch this video. It’s not long but covers the biggest part of questions on the topic.
The analyst claims that the market facilitating index models the situation more objectively than all modern stochastic oscillators and trend indicators.
Table of Contents
Market Facilitation Index work principle
The index is designed to determine the market behavior after a sharp or insignificant change in volume. It is calculated by the simple formula:
MFI = (High-Low)/Volume,
where High is the maximum price (range) value for a certain period (Volume), and Low is the minimum value. The developer compares the indicator with the energy which drives the market.
The index can control each point of price change within one tick and make accurate calculations of market efficiency for each time interval determined by the timeframe. One of the groups representatives’ – buyers’, sellers’, neutral players’ interest decrease or increase – is immediately reflected in the market productivity.
Such changes immediately affect the total volume. It’s possible to predict the trend strengthening or an early change of its vector based on the indicator’s results. MFI indicator is calculated as the ratio of the price extremum difference to the bar volume per tick.
This indicator itself doesn’t have any special significance. Its true value can be determined in comparison with the previous index only. Market readiness for new price challenges is estimated on this comparison basis. For example, there was the price movement increase for the tick and, respectively, the market’s ease has increased if the current Market Facilitation Index is larger than its predecessor.
It’s possible to determine the approximate level of trading opportunities in a specific period based on the information received. An important advantage of the indicator is attached to the current volatility, which makes it possible to assess as objectively as possible, by the actual market situation.
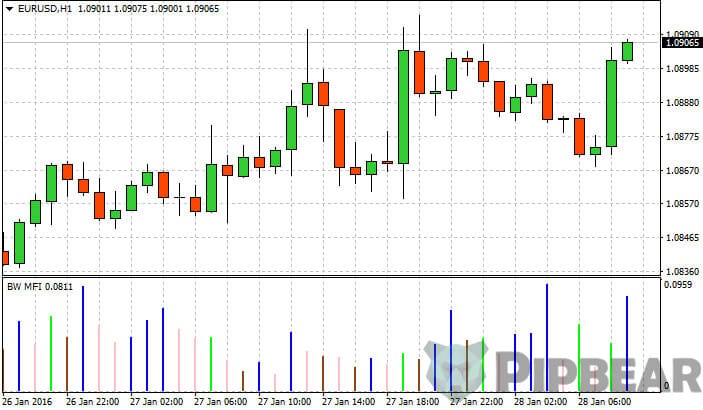
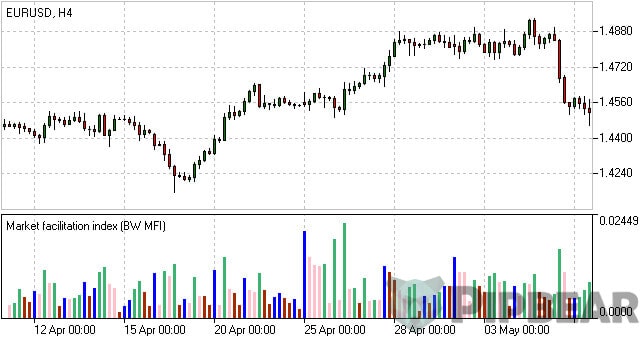
MFI indicator can be used on almost every timeframe, from minute to weekly. The tool is present in most popular trading platforms. We observe vertical bands, painted in one of four colors on the standard MFI chart:
- green – means the growth was demonstrated by both MFI and volume at a given time;
- brown – decreased both MFI and volume;
- blue – MFI grows, volume falls;
- pink – MFI is falling, the volume is increasing.

These colors are considered to be classic, but nothing prevents the user from choosing the one he likes more.
Application in trading
Volumes changes occur before the market starts to react, so index use facilitates trading.
MFI indicator demonstrates the quotations movement start. The indicator is part of the popular MetaTrader 4 trading platform. It is located in “Bill Williams”, the standard instruments group. The indicator is located in a separate window and looks like columns of different colors. Coloring can be changed in its properties. The bars coloring depends on the way the volume and index change.
- A green bar is drawn with a growing index and volume. At this moment, the market is actively moving along a certain trend. The trade number made by the traders is increasing all the time and quotes continue to move in the direction chosen.
To enter the market, this bar is useless since the optimal dot has already been missed and trade opening is very risky in this case. If a trader sees a green bar while being in the market, this confirms the decision correctness.
- A brown bar appears when the volume and indicator values fall. The trader is shown the market movement is slowing down to. In trade it is used as supplementary information only.
- The blue bar signals that market activity is increasing, but volumes are declining. It is not applied for the trades completion. Pink bar appears when the MFI decreases and the volume increases. It signals the market movement completion in the direction chosen. All the trends are completed with this bar.
- It’s easy to notice the pink bars are in the market turns to start points by setting the indicator on the daily chart of the popular tool. The trader must observe the quotations movement and instrument’s indication. Trader enters two pending orders for purchase and sale when the corresponding bar appears.
Orders are exhibited near the extremes of the pink bar. Usually the market breaks the maximum or minimum of the signal candle, clings the trader’s order and continues to move in the right direction. The second stop order is recommended to be removed when the pending order triggers.
If a green bar appeared after entering the market by the trader, this signal is considered to be the right trade direction confirmation. The entrance was made before the main market participants started moving it. The moment of the pink bar emergence is compared with a compressed spring, which can’t withstand the stress and will soon throw out all the energy.
When Volumes grow and quotes remain in a narrow range, which leads to a sharp push and a continued market movement in the direction of the momentum.
MFI indicator interpretation
Now, let’s see the meaning of a particular color band emergence.
The green line indicates the presence of a sufficiently powerful trend, which continues to be in the rapid development stage. It can be stated that more and more players are entering the market in the trend’s direction. By the way, this band is the only one in which color corresponds to the name given by B. Williams.
All the rest received more “sonorous” nicknames. A band is called this way by analogy with the green light of a traffic light. In practice, three consecutive green lines in a row inform about the market a glut and, as a rule, they are followed by a recession, especially if there are short timeframes.
Brown – on the contrary, reports the trend decline, in connection with which it was called «fading”. Players start to lose interest in the trend while preferring to close their current positions. Likewise, you should do the same. It’s contraindicated to open in such a market.
However, it should always be remembered that such “boredom” always ends with a good signal which correct assessment will open the position at the very beginning of the new trend. Several brown verticals are usually an indicator of early price reversal.
Blue color reports a trend movement that did not interest most traders for some reason. The latter is indicated by trading volume decline due to the price increase. Typically, this situation is associated with the large speculators’ behavior who try to control the market to provoke traders to open positions against the real trend.
During this period, it is better to refrain from making trades, especially to novice players. Attempts to open on this artificial trend or close against it, in most cases result in serious losses.
The blue band is also called “fake”, which fully reflects its “treacherous” character. Pink color – “squatting”, is a harbinger of the current trend’s attenuation. This band emergence informs that the price movement slows down and consolidates in a narrow corridor while waiting for the dispute termination between buyers and sellers, whose activity continues to grow.
The confrontation result is either another wave or a trend reversal. Thus, a trader gets the opportunity to enter the market at the most favorable moment, but he will have to use additional indicators to determine a new trend vector.
“Squatting” name symbolizes a certain “half-bent” position, accepted by the market while waiting for changes and allowing quick start in any direction.
Conclusion

As it was mentioned at the beginning, the author considers the MFI indicator to be the most truthful measure of the market changes state for today.
This statement can be argued, but it is difficult to deny the indicator’s advantages. This is an effective tool which helps to see the sellers’ and buyers’ mood during the investigation period as well as determine the current trend’s vector and nature.
One of its main advantages is visibility – an experienced trader can estimate the approximate alignment of forces in a matter of seconds while focusing on the bands. Also, it’s worth noting the tool’s relative independence from the timeframe duration and market conditions.
Nevertheless, even Williams does not recommend to use MFI as a stand-alone indicator.
MFI indicator will bring much more benefit in combination with other analytical indicators. It is also worth noting the tool is more effective when working in the stock markets.


Hi Coach, Sometime accumulation Distribution line going down while Money Flow index remains above or around 80 why?
Hi Sir, Can we Use this in a divergence? Positive or negative ? i m little bit confused
hey man that’s like something i’ll use all my life. thanks.
Thank you Sir for sharing your knowledge! Always listening
MFI is simply RSI weighted by volume. They are very similar.
I see the value in what you are doing …… thanks
I see the value in what you are doing …… thanks
I see the value in what you are doing …… thanks
Thanks