

A professional trader usually needs analysis of several currency pairs, as well as indicators’ indications (sorry for that) on various instruments and timeframes. Multiframe and multicurrency complex indicators of currency pairs are used to get a comprehensive picture of what is happening on the market.
Before reading the article and writing your questions in the comments section, I recommend to watch this video. It’s not long but covers the biggest part of questions on the topic.
Such technical analysis tools are especially popular for currency asset lovers who have strong cross-correlation, as well as for using signals from index or commodity assets (for example, oil or dollar index) as leading indicators.

First of all, currency pairs indicators optimize the workspace – it’s not required to open several screens to see the information on several assets. In real-time both the charts of different tools and indicators data are shown on the screen. This saves time and allows a trader to focus on effective signals.
The regularities use in the simultaneous movement of several instruments price is a simple and sufficiently reliable trading method. It does not even require extensive knowledge of technical analysis – it’s enough to be just observant. Dependencies between tools change over time, but an attentive trader can always switch to assets that have the most favorable correlation at a certain moment.
Some mutual lag presence between the tools during synchronous movement is especially welcome: it’s possible to enter the main pair in the general trend direction and subsequently – close the position in time while using one asset as an alarm. In currency pairs indicators, less volatile tool is usually chosen to be signaling (but with a more stable trend) and for trades – more mobile.
General remarks
Complex technical analysis indicators are most often developed by traders independently and therefore can be adapted for individual instruments only or require careful setting.
Obligatory settings always include the list of necessary tools for output or working timeframes which it’s necessary to take information from. The approximate structure of the minimum parameters of the currency pair indicators:
- Symbols – a list of asset symbols in the broker’s designations;
- TimeFrame – timeframes (in minutes);
- BarsOfSymbol – the number of the required bar for one symbol;
- SpaceBars – the distance between the asset charts (according to Symbols);
- LblColor – symbol’s name color (chart or data).
Typically, such tools are divided into multicurrency and multi-frame.
Representatives of the first indicators group show the charts of several currency pairs and the indicators data for them (usually for the same period) on the same screen. This helps to identify the interrelationship between different tools and makes it easier to monitor them.
The indicator’s operational results can be either digital (in the data packets form on the screen) or chart (which shows the price movement chart of several tools on the same screen).
Multicurrency options are created for almost all standard indicators (moving averages, MACD, RSI, ATR, Momentum). Such indicators have become the basis for many trading strategies creation.
Multicurrency also includes such information indicators of the market’s “moods” as Alpha, which uses stock information about the placement of the order and assesses the short-term trend’ strength for the asset.

Multiframe indicators are the ones that show data on the selected financial asset’s behavior on other timeframes on the screen of the base (working) period.
Let’s consider the most popular options offered in free access.
Multicharts multicurrency indicator allows us to see individual windows with different currency pairs in real-time. Traditionally there are shown all major ones – EUR / USD, GPB / USD, USD / JPY, AUD / USD, USDCAD.

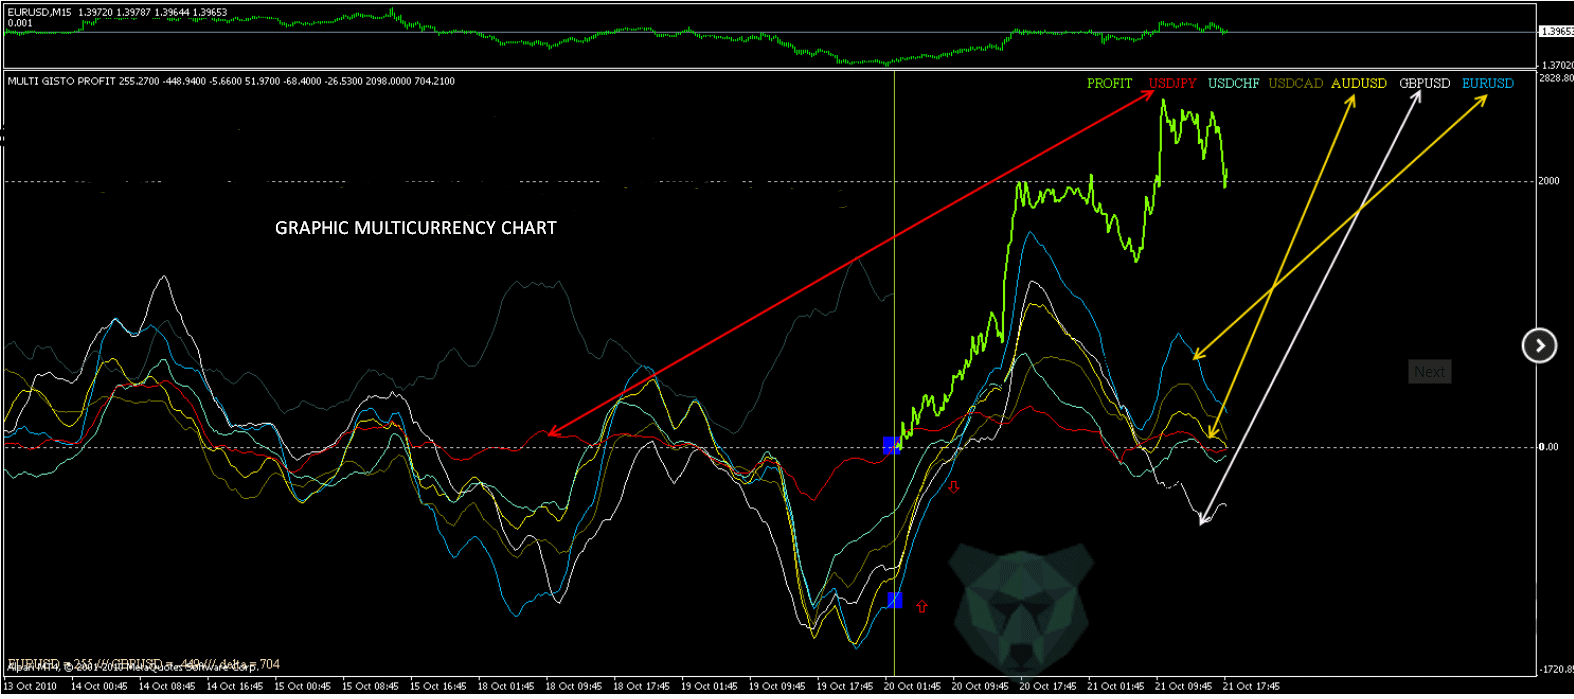
Digital indicators of TroSuk currency pairs – different versions of this family’s indicators show the price and direction of several currency assets. It is very convenient and really useful, especially it’s also possible to see the cross-tools dynamics. The color scheme contains at least three basic colors: green for the bullish trend, red for the bearish and some third for the flat. Each asset has its color.

All_CCI and All_MACD versions are recommended for fans of standard, but multi-frame indicators of currency pairs (especially for scalpers). All_Stochastic multicurrency stochastic version is rather popular – the same oscillator on different assets and in separate windows. Such indicators are located traditionally at the bottom of the main window and the price chart is not cluttered up.

Data showing from different periods helps the trader to better control the situation and respond faster to key moments of the trend reversal. The oscillator indications will not allow us to jump into the market at the right time and the multi-frame MACD will show the maturing divergence moments in time.
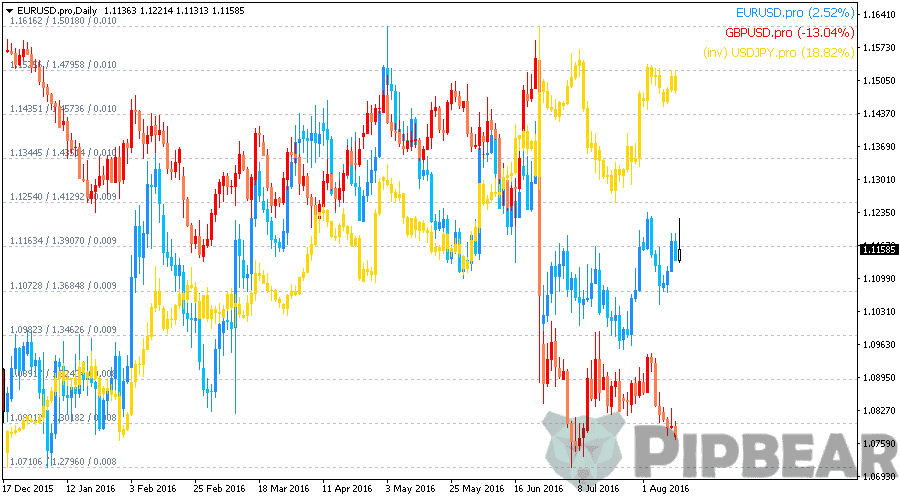
Another picture for cross-correlation estimation is the indicator’s options Multi_Pair_Chart_Indicator which covers the main charts by other tools chart and allows estimating the difference between them. The candlestick view for such indicators is heavily cluttered the price chart since usually the base currency is built in Japanese candles form and for the rest there used just colored lines:
Currency pairs indicators which reflect the dollar “positions” in pairs and showing % growth of the so-called zero bar (taken as a reference point) of a certain currency relative to all others recently appeared in the network appeared. Each bar chart’s column shows this dynamic for each timeframe: M1, M5, M30, H1, H4, D1, W1, MN. It is believed that such an indicator is very useful when trading crosses but requires tricky settings and preliminary testing.
Conclusion
Currency pairs indicators are quite appropriate for work as auxiliary or informational ones and are especially useful when using the strategies based on allied currencies use. They are indispensable when working with the news since they track the market dynamics on a variety of tools and thus increase the chance to see a good entry point in time. It’s possible even not to follow the working tool volume If skillfully using cross-correlation data – the associated pair can give a signal in advance to break the price, even if the volume indicator’s data is delayed.
But there is still one “but”. The practice shows that the different assets information showing on one working screen is much slower than in individual platform windows. I.e. additional technical resources may be required to make adequate the update speed of the chart overloaded by the information when using the currency pairs indicators.


An easy way to bring things together
Thanks man, this what I have been looking for. Am happy to have gone through your videos, this will obviously change my trades
Thanks buddy,, you are a genius man
Coach hi, first let me take the opportunity to thank you for your hardwork and going the extra mile to make everything crystal clear. I have a request, would you please put all these indicators in a single folder and share with us.
I do not know how to express my gratitude, thanks you saved me man
Sir can you offer training to a group of me and my friends?
Life changing!!
how do u download this stuff? Really need it