

The traders often ask me about the price levels on the Forex market. We have already discussed a lot of the price levels’ varieties such as the support and resistance levels, the round levels and the Pivot levels. The list will be not complete if we forget to mention another important method of creating the levels in technical analysis. Of course, we are talking about the levels having the mysterious name “Murrey levels”.
Before reading the article and writing your questions in the comments section, I recommend watching this video. It’s not long but covers the biggest part of questions on the topic.
Thomas Henning Murrey, the author of the levels named after him, made a great contribution in expanding the methods of technical analysis of the market. However, he is mostly known because he adapted certain aspects of the Gann theory and made it possible to use among the people. It is of no secret that the Gann theory is rather confusing and difficult to understand even by the highly intellectual traders, let alone the rest. Taking the theory of Gann about the price quadrature as the basis, Murrey proposed his model of interpreting the levels and made it clear to the world.
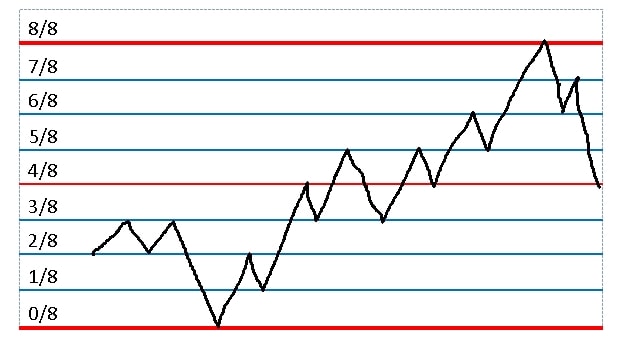
You need to find significant price extremes and divide this price movement into eight equal sections to create the Murrey Levels. The boundaries of the sections are considered the levels. Murrey gave them different names and described the most anticipated price behavior near these levels. It might seem to be very simple but the trick is to find accurately these price limits, from which the grid will be made.
DESCRIPTION OF THE MURREY LEVELS
- The 0/8 and 8/8 Murrey levels are called the final resistance levels. It is believed that these are the strongest levels that prevent further price movement. The 0/8 level provides the price support while the 8/8 level provides the price resistance. You can expect a reverse or deep retracement from these levels.
- The 1/8 and 7/8 Murrey levels are called the weak reversal levels. Nevertheless, you should pay attention to this level because, after the bounce, the price usually strives to the 4/8 level. This is quite a large price area.
- The 2/8 and 6/8 Murrey levels help to predict a possible price turn and reversal. These levels are considered the strong support/resistance levels able to reverse the price. However, I can say from my own experience that unlike the breakout of the 1/8 and 2/8 levels, the breakout of these levels is more interesting for the trades as it will be a kind of confirmation of the established trend.
- The 3/8 and 5/8 Murrey levels are the boundaries of the trading range. The price often consolidates between these levels forming a flat area, in which the major market players gain their positions.
- The 4/8 level Murrey is considered the main support/resistance level. It is some kind of the Pivot point similar to the Pivot level in its properties. If the price is above this level, then it serves as the support level. If the price is below the level, then it is considered a strong resistance level.
THE MURREY LEVELS PATTERNS
The traders use the patterns to trade the Murrey levels in practice. These are the repetitive sequential price movements between the Murrey levels that you can apply to raise your chances of getting get a profit. Let’s take a look at some of them.
- The pattern 0/8 – 4/8 – 1/8 – 8/8 is used for opening long and the symmetrical pattern 8/8 – 4/8 – 7/8 – 0/8 is used for opening short. Graphically, the patterns look like this:

- When the price passes from the 0/8 level to the 4/8 level without significant pullbacks and bounces from the 4/8 level and reaches the 1/8 level, at which it slows down, you may use the pattern to open long. If you open long near the 1/8 level with the Stop Loss order below the 0/8 level, you can expect the target of the entire price movement reached at the 8/8 level. If you want to open short, do the contrary (see the figure). You should better enter the market when the price returns to the 1/8 (7/8) level several times in a row and break it out with the shadows of candlesticks but fails to close behind the level.
- This pattern provides a very good ratio between possible profit and loss. The thing is to wait until it is done and not to close the positions at the smallest profit. You can transfer it in the black in case the price breaks out the 2/8 (6/8) level. As I have written above, this level is a kind of confirmation and the price rarely returns to the entry point after it has broken out this level. That’s how applying this example on the real chart looks like:
- Use the 0/8 – 3/8 – 1/8 – 4/8 pattern to open long and the 8/8 – 5/8 – 7/8 – 4/8 pattern to open shortly. The pattern is very much like the previous one but it has a bit smaller amplitude. First, the initial price run may reach only the 3/8 (5/8) level. After the bounce from the same 7/8 level, the price will strive to reach the 4/8 level. However, this pattern occurs more frequently so it will be applied much more often than the 0/8 – 4/8 – 1/8 – 8/8 (8/8 – 4/8 – 7/8 – 0/8) pattern.

Same rules apply. Open long when the price cannot break out the 1/8 level aiming to reach the 4/8 level. Open short when the price bounces from the resistance 7/8 level aiming to reach the 4/8 level. Set the protective Stop Loss orders below the 0/8 level for opening long and above the 8/8 level for opening short.
THE MT4 MURREY LEVELS INDICATOR
You can find the indicators for the MetaTrader 4 trading terminal that will allow you to apply the Murrey levels automatically. We added the links to the archive with the Murrey level indicators for MT4. Download it if necessary. The first indicator is used for the current chart period and the second one is a multi-timeframe and can display levels of another period. Why would you need that? It is useful to track the levels of different scales because the extreme price points on the price chart will vary while using a larger or smaller timeframe. The levels of the higher period will show a more significant impact in interpreting the price movement. So the trader must pay attention to it while planning his trade.
The indicator settings contain the “P” parameter, which stands for the period in bars for calculating the Murrey levels. It is set by default to 64 but you can pick this parameter in such a way that the price “worked out” the available levels. That would increase the probability of the correct trading situation interpretation.


could i have your email? i’m very interrested in murrey trading system, and i would like to get this indicator could send me this indicator please?
If I am using Range bars for intraday trading, what setting should I use for Murrey?
Thank you thank you…… helped me a lot
Coach, recommend a book for all these
I wish I only knew half of what you know….. I would a forex Gwiji
awesome..always enjoy your refreshers and lessons.. thanks for all the extra work you do
This things are abit complex. Advice an easy way of learning
Awesome!!!