

The key support and resistance levels are the technical analysis tools, which many traders use as the basis of making decisions. It is of no surprise since the traders believe that if the support or resistance area is strong enough, you should set near the Stop Loss and the Limit orders (used on the Forex market) near them. In other words, it is the zone of the general interest.
Before reading the article and writing your questions in the comments section, I recommend to watch this video. It’s not long but covers the biggest part of questions on the topic.
These levels are quite subjective just like everything about technical analysis. They can be drawn in different ways and different places. However, if you take the levels created by following a strict formula, then you will get the lines that cannot be interpreted in various ways. They will always keep the way they are. This is the Pivot Points. Of course, you have seen the Pivot Points mentioned in the articles describing various strategies. Today we are going to discuss them in detail.
Table of Contents
WHAT IS THE PIVOT POINT?
Each trader tries to find his trading approach on the Forex market. Some of them rely on intuition while others strictly follow the rules of the trading systems. However, some try to apply a mathematical approach to the Forex market and find patterns in the price behavior. They try to calculate the price direction as well as the bounce or breakout of the corresponding levels. One day, Henry Chase, a well-known trader, and mathematician developed the Pivot levels long before the computers appeared (in the 30th of the XX century). These Pivot levels are calculated based on the maximum, minimum and closing prices of the previous day. If you make simple calculations, you will get the levels, at which you can expect the price breakout or bounce.
The word “Pivot” stands for “Reverse” and the traders on the financial market usually call the Pivot point this way.
In technical analysis, determining the reversal point is very important. The pivot calculation method and trading strategies based on the pivot points are used in almost every financial market. This is a simple calculation system used by the largest banks and funds for over half a century. Professional traders also use reversal points (pivots) to identify important support and resistance levels. The Pivots are especially useful in case of the intraday trading and trading on the short timeframes, the purpose of which is to take advantage of the relatively small price movements.
Despite the Pivots were invented quite a long time ago and the market has changed over the following years, the Pivot levels are still working on the Forex market and the Pivot trade can still bring a good profit. Moreover, they have developed various Pivot Levels indicators, which significantly simplify the trader’s work. Now you do not need to make complicated mathematical calculations since the computer will make it all for you. However, to fully understand the essence of these levels, we are going to discuss in detail how they are calculated and put on the chart, and also study various Pivot Levels, the typical indicators and trade features for them.
PIVOT POINTS VARIETIES
The classical Pivots were developed almost ninety years ago so don’t be surprised that several different versions have appeared. You may see the following versions of the Pivot Points:
The traditional and classical versions of the Pivot Levels are very much alike. The DeMark Pivot Levels are slightly different from the classical Pivot Levels and rather are the levels that the price can reach over a certain period. They were developed by the famous analyst Thomas DeMark (the author of the well-known oscillator).
The Woody Pivot Levels are similar to the standard Pivot Levels but they are calculated in a slightly different way, paying more attention to the closing price of the previous period. The Camarilla Pivot Levels are a set of eight levels that serve not only as the support and resistance areas but also as the zones for putting the protective Stop Loss orders and possible goals for the Take Profit orders. It was developed by Nick Scott, the well-known bond trader.
TRADITIONAL PIVOT CALCULATION FORMULA
The Pivots and the corresponding support and resistance levels are calculated using the values of the last trading session. The opening, closing, minimum and maximum values are applied in this case. Since trading on the Forex market goes 24-hours-a-day, most traders treat the closing time of the New York session at 4 EST as the closing time of the previous trading session. Depending on the time of year, it can be 11 or 12 pm Moscow time.
The easiest way to identify the support and resistance areas is used by the Wall Street guys for decades. They just take the maximum, minimum and closing price over a certain period and divide it by 3. So that’s how they get a reversal point (a Pivot).
Let’s take a look at the reversal point calculation and calculate the Pivot level:
- Pivot = (High + Low + Close) / 3, at which
- high — the maxima of the previous day;
- low — the minima of the previous day;
- close — the closing price of the previous day.
After that, calculate the support and resistance levels using the Pivot values:
- R1 = 2Pivot — Low;
- S1 = 2Pivot — High;
- R2 = Pivot + (R1 — S1);
- S2 = Pivot — (R1 — S1);
- R3 = High + 2 × (Pivot — Low);
- S3 = Low — 2 × (High — Pivot), at which:
- R1, R2, R3 — resistance levels;
- S1, S2, S3 — support levels.
DEMARK PIVOT CALCULATION FORMULA
The DeMark Pivot Levels is another popular approach to calculate a simple technical indicator that helps to predict the future of the trend. They are not exactly the pivot levels but more like the predicted levels of the highest and lowest values over a certain period. To calculate the DeMark Pivot Levels, follow these rules:
IF (Close < Open), THEN Pivot = High + 2 × Low + Close,
IF (Close > Open), THEN Pivot = 2 × High + Low + Close,
IF (Close = Open), THEN Pivot = High + Low + 2 × Close.
The new support level S1 = Pivot / 2 – Low,
The new resistance level R1 = Pivot / 2 + High, at which:
- high — the maxima of the previous day;
- low — the minima of the previous day;
- close — the closing price of the previous day.
WOODIE PIVOT CALCULATION FORMULA
The Woodie Pivot Levels are very much like the usual pivots but they are calculated in a bit different way, giving more emphasis on the closing price of the previous period. Apply the following rules to calculate these levels:
Pivot = (High + Low + 2 × Close) / 4
Resistance (R1) = 2 × Pivot – Low
R2 = Pivot + High – Low
Support (S1) = 2 × Pivot – High
S2 = Pivot − High + Low
PIVOT CAMARILLA CALCULATION FORMULA
The Camarilla Pivot Levels is a set of eight levels that correspond to the support and resistance values for the current trend. No one truly knows the source and the exact way of calculating these Pivot Levels. What is more important is that any trader can use these levels and establish the correct values for the Stop Loss and Take Profit orders. Use the following rules to calculate the Camarilla Pivot Levels:
R4 = (High − Low) × 1,1 / 2 + Close
R3 = (High − Low) × 1,1 / 4 + Close
R2 = (High − Low) × 1,1 / 6 + Close
R1 = (High − Low) × 1,1 / 12 + Close
S1 = Close − (High − Low) × 1,1 / 12
S2 = Close − (High − Low) × 1,1 / 6
S3 = Close − (High − Low) × 1,1 / 4
S4 = Close − (High − Low) × 1,1 / 2
CALCULATING PIVOT POINTS ONLINE
You can find the ready-to-go several types of the Pivot Points (they are called the reversal points). On the side, you can choose the required interval (timeframe):

The only thing you must do is to find these points at the chart and set them manually by the quotes.
Don’t forget that the larger the timeframe, the more important the support/resistance level.
PIVOT POINT INDICATORS
Fortunately, we can assign all the complex calculations to the computer. The Pivots are no exception.
Don’t forget that some Pivot Points indicators provide additional opportunities for calculating the third support and resistance levels, which is known as the intermediate or median levels. These additional levels are not as significant as the main five but you still need to pay attention to them.
PRACTICAL USE OF THE PIVOT POINTS
You can effectively work with the reversal points knowing only three things:
- The stock of trading for a trading session (or a day) taken from the average daily volatility.
- The reversal point within the trading session or day.
- The trend direction.
There is a rule of determining the trend. If the market of the current trading day opens above the central Pivot Level, then you should better open long during this trading day. If the market opens below the central level, then you should better open short within this day. If the market opens above the level but breaks it top-down after that, you should be trading within the channel.
In the figure below, you can see the week Pivot Levels on the 4-hour chart of the EURUSD currency pair.
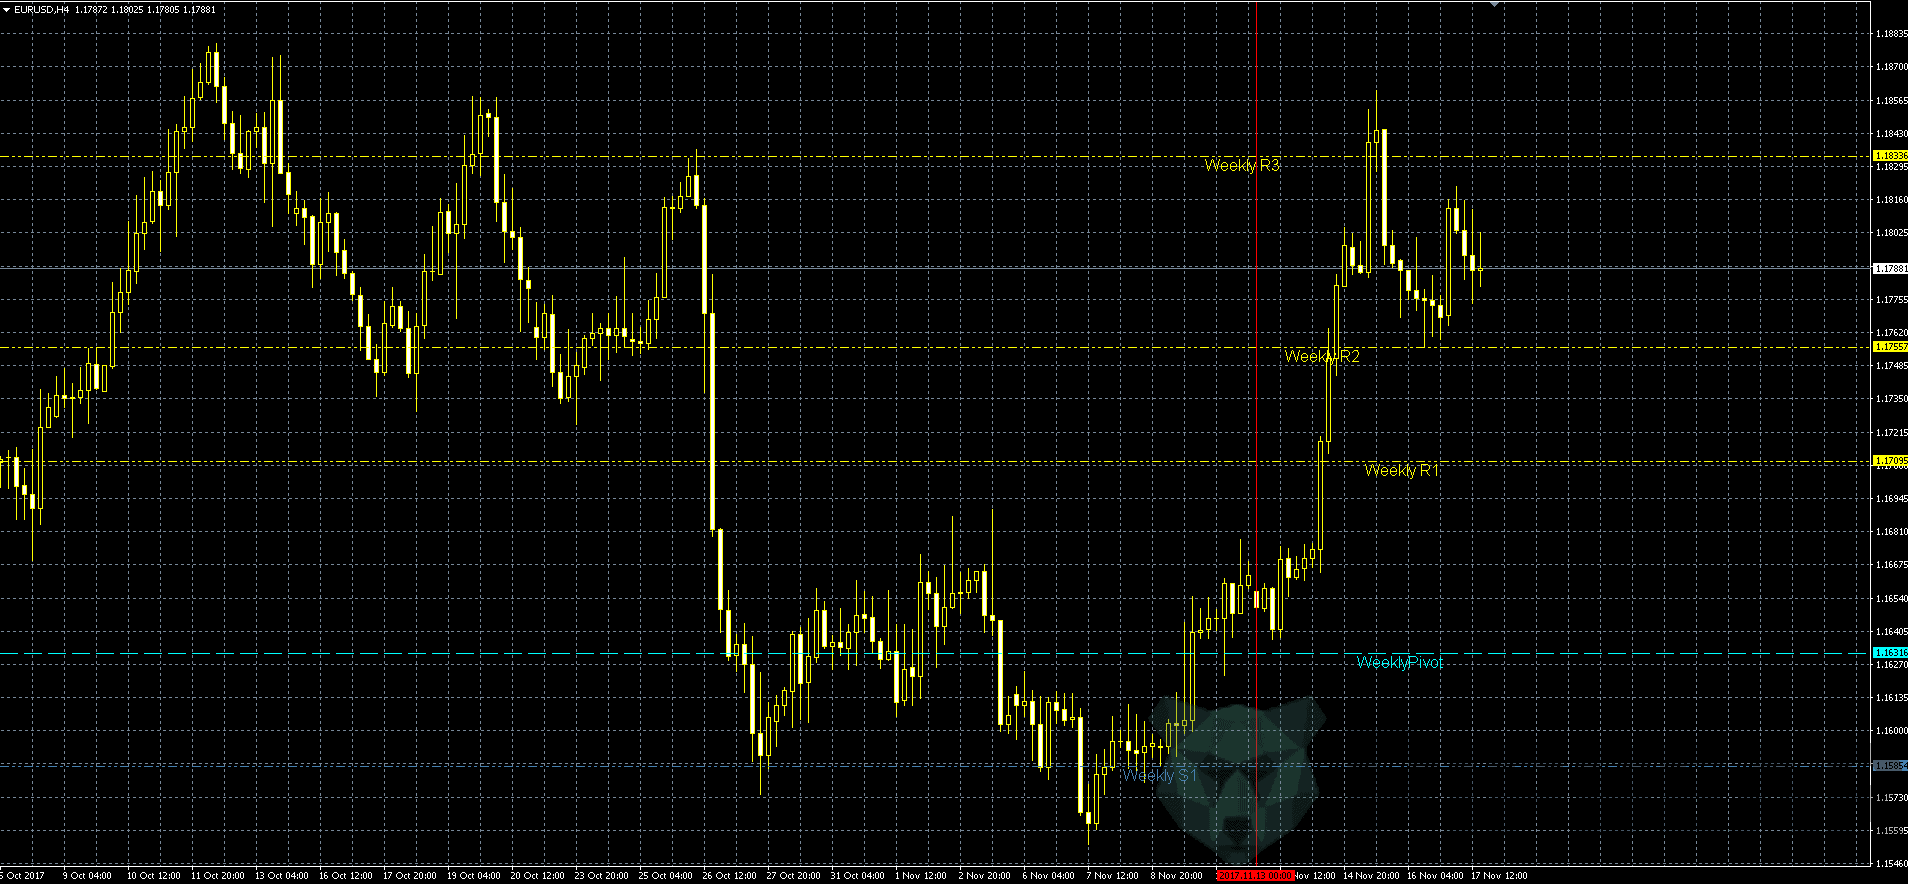
In this case, the new weekly market opened above the week Pivot Level. So you can expect an uptrend during the week. That’s exactly what happened.
In general, the reference center and the R1 and S1 points are the most important from the point of the practical trade. How do you trade on these levels?
First of all, you should determine how exactly the market opened about the Pivot. In the case it has opened above the Pivot, you should look for the opportunities to open long. After that, you may expect to reach the R1 or the S1 level independence of how the market has opened. In our case, you can expect the price reaching the R1 level and a bounce or breakout after that:

So you got a completely textbook case. The price has broken through the R1 level and then you got a slight pullback to the broken level. At that moment, you definitely could have set a pending Buy order on the high of the retracement candlestick. In case of the false breakout, you would need to simply delete the order and start to act following the strategy of trading within the channel (let’s discuss it a bit later). Set the pending Stop Loss order at the minima (plus a couple of points indent) of the candlestick, which broke through the level. In our case, the Stop Loss order was 27 points.
You should note that the shorter the Stop Loss orders, the more often they are activated. Therefore, if you like to give the price some time for action, you can set the Stop Loss order behind the nearest minima or maxima. On the contrary, if you prefer a high percentage of profitable trades, you may set the Stop Loss order behind the Pivot level. If the price crosses it, you can be sure that everything goes by the plan.
I think you should divide the initial order into two parts for different goals. For the first order, set the Take Profit order at the R2 level and for the second one – at the R3 level. When the first Take Profit order is activated, transfer the second one in the black and start moving it after the price.
Quite often, by the time the market reaches the S2 and S3 or R2 and R3 Pivot levels, the market is already overbought or oversold. In this case, use these levels to close the positions instead of opening new ones. Therefore, splitting the positions, partial closing and transfer of the remaining part in the black (while reaching the R2 or S2 levels) can many times save you from getting a Stop order. At the same time, you can still make good money on this approach as we have done in our example.
Besides, don’t forget about the average day volatility. This is the average number of points, which the chosen currency pair usually takes during the day. I advise you to determine it in the following way:
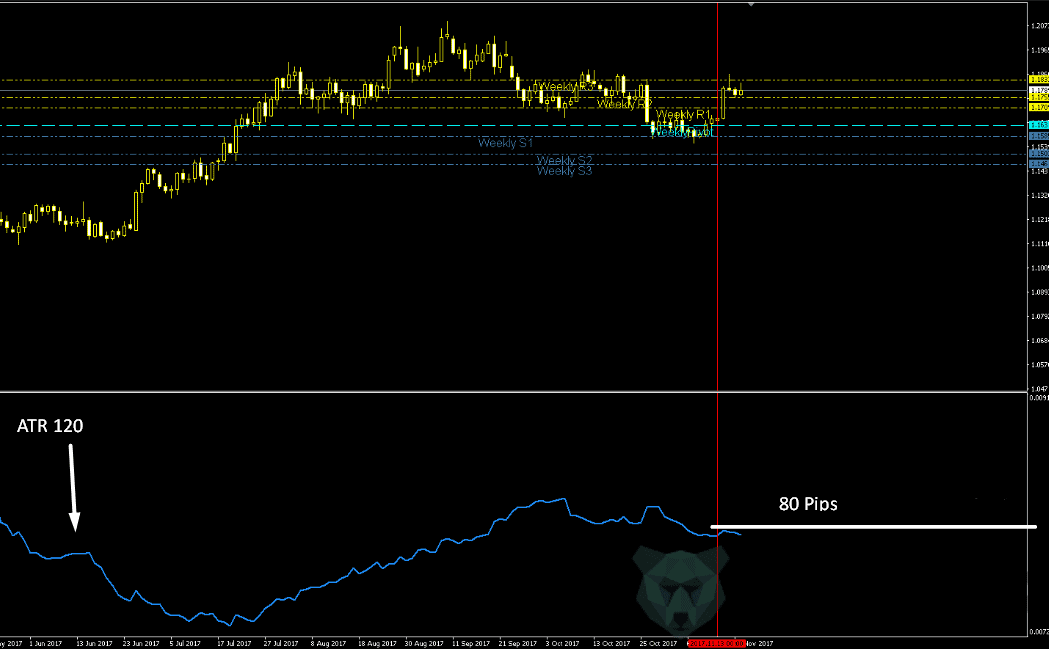
The ATR indicator determines the tool volatility. The ATR indicator determines the length of the day candles on the daily charts. That is how far the price can move after the day’s opening. The ATR with a period of 120 points determines the average length of a day candle over six months: 20 working days a month multiplied by 6 months.
Thus, you can set defer 80 points from the daily opening price. In our example, it matches the R2 level. Of course, this is not always the case so the average price movement should be taken into account in trading, especially in case of the intraday trading. At least that will help you not to open long at the daily maximum and not to open shortly at the daily minimum. Also if the price goes for such a distance from the day opening level, you can consider it the signal to transfer in the black, for example, or close some positions.
And if the R1 and S1 levels are not broken out or the price breaks through the Pivot Level in the opposite direction, you may think of entering the market at the price bouncing from these levels and further trading within the channel between the R1 and S1 levels.
Pivot Levels trading is very much the same as trading using classical support and resistance levels. Therefore, pay attention to the price behavior near these levels and don’t forget about the main candlestick setups.
As you see, the rules of the Pivot levels trading are very simple in theory. However, the pivot levels do not work out every time in the real market conditions. The price can fluctuate near the Pivot levels and sometimes it is very difficult to foresee which direction it will take.
Sometimes the price stops before reaching a Pivot level and reverses in a few points from your goal. In another case, for example, it seems that the Pivot Level seems to be quite a strong support level and you may open long. And right after that, the price reverses and moves down fast towards your Stop Loss order.
Therefore, I suggest using the trading template designed to simplify your task as much as possible.
- Take a look at the weekly opening price. If it is below the Pivot Point, open short (and vice versa).
- Track the price. Wait until it reaches the S1 level to start opening short and opening long at the R1 level.
- If the price has crossed the Pivot level in another direction, trade within the channel. Trade on the bounce from any levels (Pivot, S1 or R1) until the price reaches the S1 or R1 level. In this case, stop the trade since the levels are quite far away and the price is very likely to bounce from them. Also the price has remained long enough within the channel and accumulated enough strength to keep moving.
- If the price has reached the S1 / R1 level (depending on the direction) and broken through the level, you may expect another candle after the breaking one. Usually, the price pulls back to the level providing an opportunity to set a pending order.
- You may pick the S2 and S3, or R2 and R3 as your targets. As for the Stop Loss order, the traders usually take either the nearest local maxima/minima or the ATR readings multiplied by 2 or 3. We recommend using the period of 24 for the M5, M15, H1, and H4 timeframes and the period of 20 for the D1 timeframe.
- While working on the trend, we advise you to enter the market with two orders. Close the first one at the S2 or R2 level. Transfer the second order in the black after closing the first one and pull up the Stop Loss order after the price. In case the price failed to reach the Take Profit order by several points and began to reverse, close the transaction manually not waiting for the order to activate.
- I don’t advise the budding traders to trade from the Pivot Point level while trading by the channel strategy. I suggest taking only the S1 and R1 levels. The thing is that you get a lot of false signals while working on the Pivot Point and it’s quite easy to get confused. The price often breaks through this level in different directions but doesn’t move anywhere.
Let’s try to take a closer look at some situations to better consolidate what you have learned today. I do not recommend the beginners to trade on the periods lower than the H1 period. Therefore, we will discuss this period as well since all the basic rules for the Pivot Points trading are applicable for any period. All you need to do is to pick the right Pivot period for each timeframe. Pick the month Pivot for the D1 period, the week Pivot for the H1 and H4 periods, and the day Pivot will be good enough for everything lower than the H1 period.
Example #1. The AUDUSD currency pair.

- The new week market opened below the level so seek for opening short at the S1 level after it is broken out.
- The price breaks out the level at point #2, after which the price pulls back to the level at the next candle. The candle looks like a pin bar but we still (let us say so) set a pending order at the minima of this candle.
- After that, the set order will be activated. In other cases, we would get a few extra opportunities to enter the market at points #3 and #4.
- If we set the Stop Loss order far enough (the last maxima dovetails with the Pivot level in the example), we will reach the first goal at the point #6 (the S2 level) after the order is activated.
- After that, things may have gone in the black since the price has bounced from the S2 level for quite a long distance.
- If it hadn’t happened, we would have reached the average day volatility at the point #7 and then the S2 level as well. Anyway, we would have gotten approximately a 35-points profit using the half of the order as well as the second half would have been closed in the black.
Example #2. The USDCAD currency pair.

- The market opened below the Pivot in the point #1. So open short.
- After that, the Pivot Level was broken out for buying at point #2. So now, we start trading within the channel and work on the bounce from the Pivot, S1 and R1 levels.
- The Pivot level was broken out at the point $3 and since we are working within the channel, we should set the pending order a bit above the level. we can set the Stop Loss order to the nearest minima or by the ATR indicator as usual.
- The pending order was activated but did not reach the goal. It happens quite often when we’re dealing with the Pivot Points within the channel, so we would recommend either setting the Take Profit order a bit beforehand or watch the market situation and close it manually if the price fails to reach and starts to reverse. As they say, the bird in the hand is worth it.
- We got another opportunity to enter into the market with the pending Buy order and this time the price has successfully reached the goal.
- The level was broken out at the same point #5 so this time we should set the Sell order. This order was activated fast and has brought you 55 points while being on the market for about 1.5 days. There is nothing to be done, the market may be that way as well. However, at the same time, following the rule of premature closure, we could have finished it within just a day, the price almost reached the point #6 (4 points from the target) 12 hours before that and then reversed.
- The level was broken out again at the point #6. Well, you know what to do. This time, the price had broken out the R1 level but then returned. It didn’t make any sense to trade anymore since it was a Friday night and a new week would bring completely different levels.
Example #3. The USDJPY currency pair.
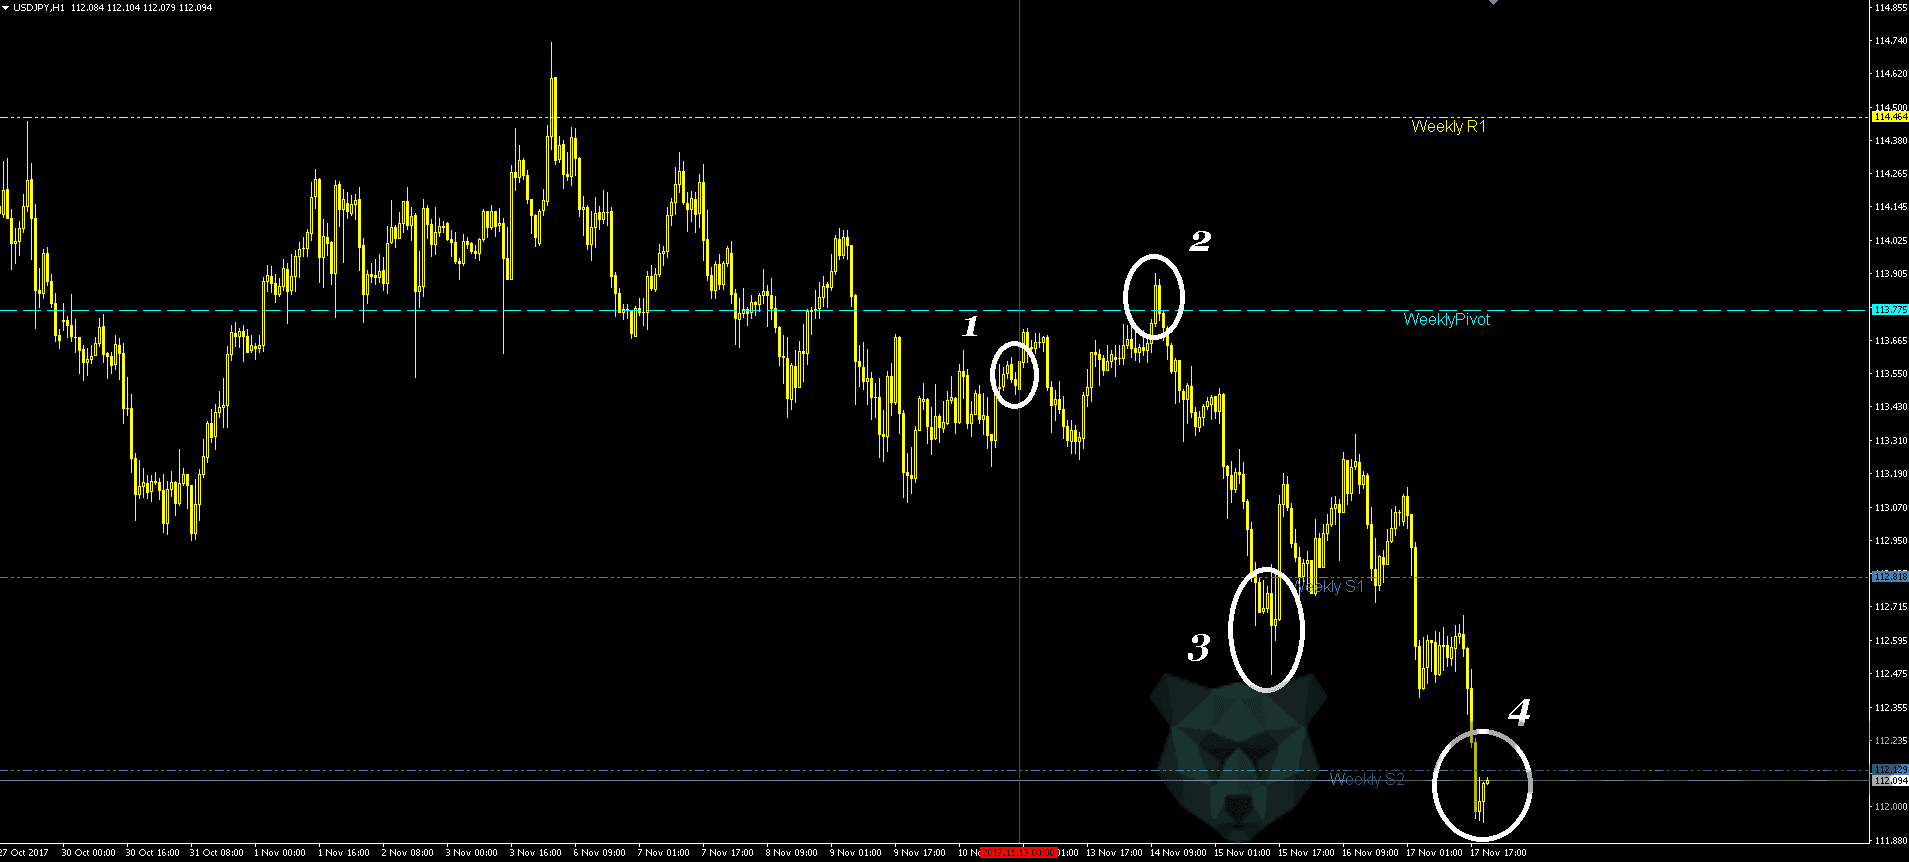
- The week opened below the Pivot. So open short.
- The Pivot Level was almost broken out at the point #2. If this had happened, we would have started to trade within the channel. But in this case, we should keep waiting for the price reaching the S1 level and its breaking or bouncing back to the Pivot level.
- The S1 level was broken out at point #3 so we have taken only the first goal at the S1 level. It was only a few hours before the weekend so close all the transactions and go have some rest.
Example #4. The GBPUSD currency pair.

- This is probably the most interesting example. The week opened above the Pivot level so open long.
- The price has broken out the Pivot level almost right away and so you should start to trade within the channel.
- We entered the market at point #3 activating the pending Buy order with the target near the Pivot Point. If we were late, we could do that at point #4.
- We have taken the profit at point #5 for long and now we should prepare to open shortly.
- The order was activated at the point #6 and we will get the Stop Loss order either at the point #7 or #9. As I have said before, I don’t recommend the budding traders to deal with the Pivot level because of such behavior.
- If we got the Stop Loss order at point #7, then we could open long at the point #8 with the target at the R1 level and get a profit at the point #10. We didn’t set the order at the point #10 since the level wasn’t broken out, the candle just touched it with its tail and closed above the level.
Example 5. The USDCHF currency pair.

- Let’s take a look at the week’s opening. We should open short again.
- The price has tried to break out several times at point #2 but stood still anyway. We have reached the S1 level at point #3.
- In general, the real breakout of the level at point 3 never occurred since the just touched the level with its tail and then sharply went far from the level. So, perhaps, someone would have missed such a signal while the others would have set the pending order.
- Those who had set the pending order, they would have gotten by reaching the first target at point #4 and the second one would have gone in the black.
- The price got back and we should forget about this currency pair till the next week.
Well, here comes the last example illustrating the opportunity to trade following the same rules on the smaller periods. Let’s take a look at the USDJPY currency pair for the M15 period and the day Pivot levels.

- The day opened below the point #1 so open short.
- The level was broken out at point #2 and we have reached the goal at the point #3.
- After a while, we have reached the second goal as well.
The only thing you should pay attention to while working on the small periods is that the levels are often broken out with no pullbacks in the sharp movements that are difficult to catch. If you set a pending order right behind the level until the price has broken it out, you will get more loss-making trades. Therefore, you do need some practice. Start trading on this system from the H1 period or maybe even the higher one.
CONCLUSION
The Pivot Points is the technique used by the professional traders and market makers. It enables you to determine the entry and exit points of the current day’s session based on the previous day’s results. The Pivots can be extremely useful in Forex trading since many currency pairs well deal with these levels.
The Pivots are quite simple to use, which certainly makes them a useful trading tool worth having in service. Master using the Pivot levels with other technical analysis tools such as Japanese candles, the MACD line crossings, the moving average crossovers and the overbought/oversold Stochastics levels.
Good luck and see you next time!


Great content with clear demonstrations
You’re my first inspiration now I’m making hundreds and sometimes thousands a day. I just want to say: THANK YOU
One of the best content shared ever…Well broken down. I will add [Pivot points + Identifying good ranges] to my trading strategy. Cheers!
Yes! Yes! Yes! you drop another BOMB shell in the market and respect for your knowledge!!!well very soon ima take a class with you
Thanks coach
Invaluable skills here
This was a complete aha moment. the thing you taught filled the void. A complete thanks
Beautiful logic coach