

Many of us scorn to classic indicators that are available by default in the trading terminal. But there is no purpose for that.
Before reading the article and writing your questions in the comments section, I recommend to watch this video. It’s not long but covers the biggest part of questions on the topic.
Do you know how they got there, why did they become classic? Because they work. They worked many years ago, due to which they became famous, and they still are working now.
Today we will focus on, perhaps, the most famous oscillator – Stochastic (Stochastic Oscillator). We will talk about how this indicator was created, what it means, as well as about the strategies of application, and many of them you have hardly heard about)
Meet Stochastic!
About thirty years ago a belief dominated among market analysts that stock prices depend on so many factors that it is impossible to predict them. However, the systematization of the trading experience and development of computer technology demonstrated the ability to forecast the behavior of market prices. A tempting prospect to “make” a lot of money has inspired many mathematicians to develop a variety of price forecasting techniques. These techniques were later called “indicators“.
There are thousands of indicators already. Even though some of them are known only to a narrow circle of specialists, many indicators are well known to most traders, including beginners. One of the most popular indicators (including Forex) widely used in trading systems is the stochastic oscillator, which George Lane began to develop since the early 1950s. This oscillator popularized by George Lane is very similar to the RSI line. Welles Wilder’s Relative Strength Index (RSI) and Stochastic are the two most popular and well-known improvements of the basic Larry Williams %R oscillator, actually the same stochastic, but not so smooth, and its scale is turned upside down.
Thus, Stochastic is one of the most popular indicators. It can be found on all available services, offering a variety of charts in all of the trading software packages and MetaTrader 4 is not an exception. Nevertheless, many traders, especially beginners, are not using it properly.
Table of Contents
History of creation
Stochastic Oscillator was developed in the late 1950s by George Lane, the president of the “Investment Educators” corporation. All calculations had to be done manually and the group of traders was developing formulas for oscillators, giving them names successively %A, %B, %C, etc. Only three proved to be working: %K, %D and %R. According to a legend, one of the Poles, helping Lane, had a friend, an old immigrant from Czechoslovakia. He told him in his bad English about the formula they used in Czechoslovakia when it was necessary to find out how much of limestone should be added while smelting into iron ore to produce steel. They took this formula, adapted it to fit their goals and started playing with it. That is how Stochastic was born.
The first two curves (%K and %D) are known as Lane’s stochastics, and the last (%R) is named after Larry Williams. Another version of the origin of the names of the Stochastic lines: %D – from the word deviation,%K – from the name Kelly (second name of George Lane).
George Lane was going to become a doctor, like his father. One day he accidentally visited the stock exchange and what he saw was very interesting to him. In the late ’50s, Lane bought for $25 a Chicago Open Board of Trade membership, now known as MidAmerica Commodity Exchange, and began trading crops. Later, George Lane became president of Investment Educators Inc and invented Stochastic, an indicator, widely used all over the world. George Lane passed away on 7 July 2004.
What does Stochastic evaluates?
Stochastic Oscillator is an indicator of the rate of change, or impulse of the price. Stochastic evaluates the speed of the market by determining a relative position of the closing prices in the range between maximum and minimum of a certain number of days. The simplest oscillator takes the current price and subtracts the price from a few days ago. Let’s assume that trades on the EURUSD pair were closed today at 1.2050, and at 1.200010 days ago. In this case, the oscillator value would be equal to 0.0050. The process is repeated every day, and the data is placed on the chart.
For example, a 14-day stochastic indicator measures the position of the closing prices within the entire range between the high and low for the previous 14 days.
Stochastic expresses the ratio between the closing price and the range of “high-low” as a percentage from zero to 100. The value of the stochastic oscillator of 70 or higher indicates that the closing price is near the upper limit of the range; Stochastic of 30 or lower means that the closing price is near the lower limit of the range. That’s it. Simply put, if you see a 50% indicator, it means that the closing price lies exactly in the middle between the high and low.
If the indicator is 75%, then the closing price is between the high and the low at 75%. In other words, it would be at the level of 75% of the daily range or closer to a maximum than to a minimum. Thus, if the market closes at a maximum every day, then you can see on the stochastics only an indicator equal to 100%. The main idea is that if the market tends to close at the top of the daily range, then it is bullish, if it is at the bottom, then it is bearish.
Oscillators will report the reversal of the market before the price changes because momentum changes lead to changes in the actual prices. The same is true in physics: the rate of change of velocity of an object will show a decrease in impulse as long as the object does not change direction.
The fact that the oscillators sometimes give a signal to trade, while the market is in a strong trend, and the signal appears to be false, is a matter of criticism. It is known that the oscillators work well on non-trending markets and bad on the trending ones. The simpler the oscillator, the more sensitive it is to changes in the current market price. For example, a simple oscillator, which is based on the 10-day rate of change is more sensitive to changes in current prices than the oscillator based on the 30-day rate change.
Many analysts have been hit hard by the use of simple oscillators, so they were trying to improve them. Stochastic shows the position of each closing price in the previous interval of the maximum and minimum prices. Stochastic is more complicated than Williams’ %R. It has several steps of removing market noise and suppression of bad signals. Stochastic consists of two lines: the fast one, called %K, and the slow one, called %D.
The most common and classic formula for calculating Stochastic is the following:
![]()
where max(Hn) is the maximum high for N periods
min(Ln) is minimum Low for N periods
C0 – closing price of the current period.
![]()
i.e. the moving average with a period M of %K
This version of the Stochastic indicator calculation is used in most technical analysis programs.
However, there are several variations, for example:
![]()
where
![]() – moving average with a period N from the minimum price for the last 3 periods
– moving average with a period N from the minimum price for the last 3 periods
![]() – moving average with a period N from the maximum price for the last 3 periods
– moving average with a period N from the maximum price for the last 3 periods
Similarity with the RSI line
As I have said, Stochastic is very similar to the RSI indicator that we have discussed not so long ago.
The time interval for both indicators is typically 9 or 14. Stochastic is also placed on a scale from 0 to 100. However, the boundaries of overbought and oversold are slightly wider than the RSI’s, in the sense that the stochastic above 80 is a signal of overbought and below 20 is a signal of oversold. This is because the Stochastic Oscillator is more volatile than RSI. Another major difference is that the Stochastic Oscillator uses two lines instead of one. The slower %D line is the moving average of a faster %K line. The presence of two lines instead of one distinguishes Stochastic from the RSI line and gives more importance to the first one. The point is that the exact trade signals by Stochastic Oscillator are given when the two lines are crossed, and when their value is above 80 or below 20.
Parameters and the calculation of the indicator
%K period line is the period of the oscillator itself.
%D period is a period of the signal oscillator line, which is simply a moving average of the %K line.
Slowing is additional smoothing of %K and %D lines.
Price field – the price range to calculate the oscillator – by highs/lows of the candles or by the closing prices.
MA method – the method of calculation of %D line, everything is the same as for the simple moving average.
One of the stochastic lines is indicated by solid and the other one by dashed line:

The solid line is called the main, it is the %K line. The dotted line is called the signal line, it is a D% line, which is a moving average of %K mainline.
I will make an example of the calculation of the indicator with the parameters 1433.
- Fast line (%K) = 100 [(closing – the lowest value for 14 days) /
(the highest value for 14 days – the lowest value for 14 days)]. - The slow line (%D) = 3-period moving average from the %K data
Then the two resulting lines are smoothed by 3-period moving average. We can see the result on the chart. This Stochastic is called slow because of this additional smoothing. To get a fast stochastic, it is enough to replace our parameters from the example of 1431. The most commonly used is the slow stochastic.
The most important setting of the stochastic is the first parameter of three is the Stochastic window, which determines the number of bars to be included in the calculation. The other two parameters define only the degree of smoothness of fast and slow lines. Stochastic inventor George Lane recommended a period of 9 to 21, and the authors of the book “Computer analysis of futures markets” recommended settings 9-15. In this case, in the platform MetaTrader 4, default parameters 533 are used.
To determine the optimal period of the stochastic, you should conduct your research, taking into account the fact that for each currency pair and each timeframe a different period will be optimal. Thus, in general, I can recommend some ranges to find the optimal values: up to M30 – the period 9-13, H1 – 14-21, H4 and above – 5-9. Do not forget that to search for divergences and identify overbought/oversold it is better to use different settings. And, of course, as usual, the higher the indicator period, the less sensitive to insignificant market fluctuations it becomes and the later it will react to price changes.
Overbought/oversold levels for this indicator are considered to be 20 and 80, but you are, of course, not limited in your self-selection of the levels. In a quiet market, while scalping in the Asian session, for example, fast stochastic with 7/3/1 settings and levels 30 and 70 suit great.
The author of the indicator recommends using stochastic on the daily and weekly charts, as it generates the most reliable signals on them. It is known that George Lane (Stochastic inventor) used to use it with 3-minute bars when trading with futures on the S&P 500 index.
Fast Stochastic against slow one
I mentioned about the existence of two kinds of stochastic: fast and slow. Fast Stochastic has a large number of dents and sudden jumps, so most traders use the slow one. Slow Stochastic lines are considered to be more reliable, but they lag a lot.
The main stochastic oscillator signals
The interpretation of stochastic signals is similar to the RSI line interpretation. These are situations of overbought and oversold (in this case, however, the values of the levels: 80 and 20), and the search for potential differences. Unfortunately, while studying the stochastic lines’ movements, many powerful tools as in the case of RSI are not used: search for graphic figures (triangles, flags, head and shoulders, and so on), levels and trend lines.
Still, what distinguishes stochastic from RSI, is an additional line that adds a really valuable ingredient to this oscillator. However, some traders still use levels, trend lines and figures for stochastics, so try to experiment: in the end, Stochastic and RSI are similar.
- Divergence
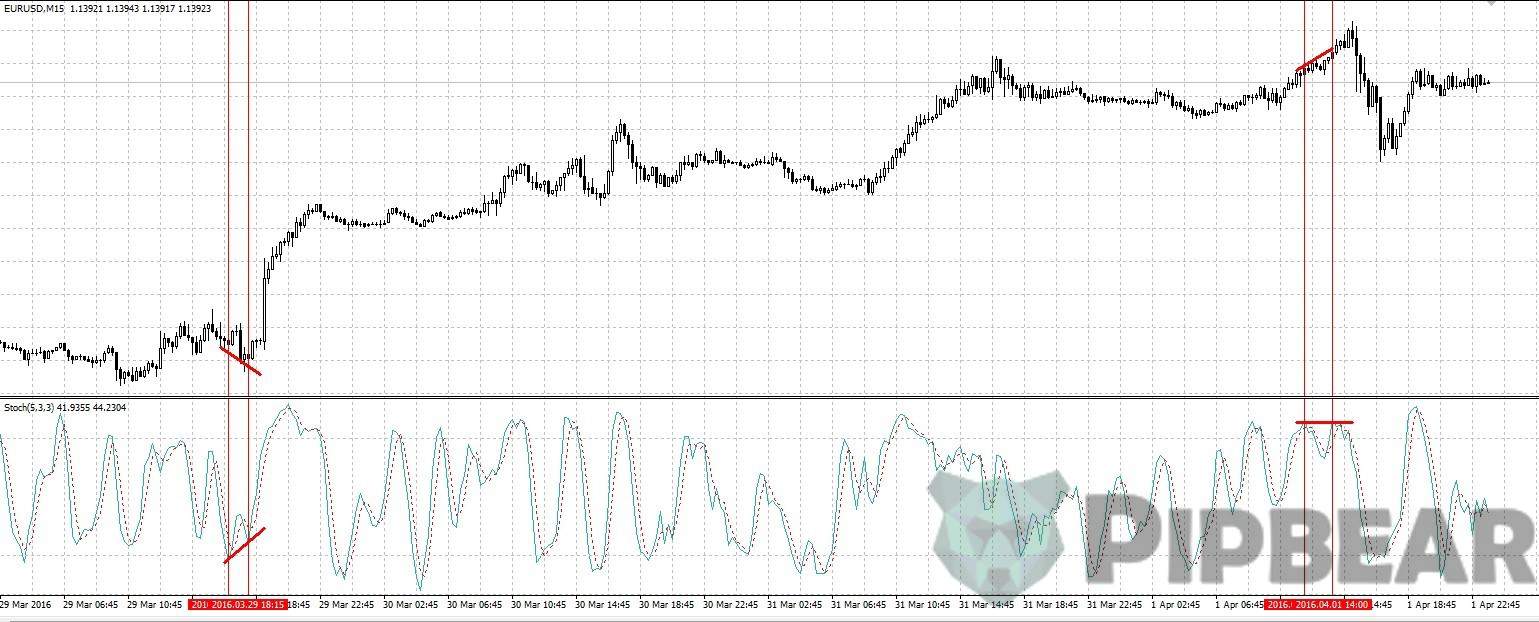
The best signal from the stochastic oscillator is considered to be the divergence or difference between the %D and %K lines, and the price. When the price reaches a new low and the oscillator provides a higher low, there is a discrepancy, and a good long signal appears. Each trader must determine for themselves, which of the lines to use to determine the divergences. At the same time, as it is seen from the illustration, it is necessary to take only divergences formed within the zones of overbought/oversold: they are more reliable.
By the way, there are separately short and long divergences. The short one takes the period of 3-7 bars (as shown above), the longer one is more extended in time.
- The levels of overbought and oversold.
By default, the levels of 80 and 20 are regarded to be overbought/oversold levels.
Stochastic oscillators work best at wide price ranges or soft trends with a slight up or down skew. The worst market for normal use of stochastic oscillator is a market which is in a steady trend with only minor corrections.
Stochastic Oscillator, in the case of a sustained strong trend, can stay for a long time behind the overbought/oversold levels, so the intersection of these levels is a bad signal for the entrance to the position:

The reverse crossing of these levels by the indicator can be a good entry signal for the main trend correction, where Fibonacci levels can be a good filter:
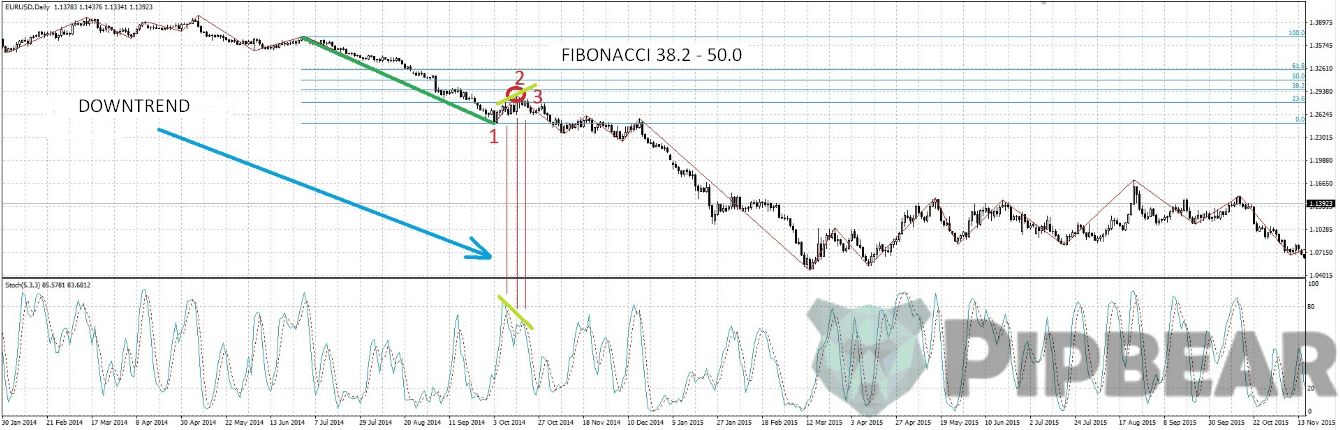
In point 1 on the picture above Stochastic already signals the opportunity for sales. The price has not yet reached the Fibonacci 38.2% level from the previous movement (for different pairs, these values must be determined empirically, depending on the volatility of the pair, on average, from 38.2% to 61.8%), saving us from premature opening. In point 2, the price reached a level of 38.2%. In point 3, a divergence was formed, after which there was an intersection of the main and signal lines of the indicator.
- The zero line 50.
Based on the formula of the indicator, it is clear that when Stochastic most time is in the range of 100 to 50, there is an upward trend, and vice versa for the range of 0 to 50. It is possible even to enter the market at the intersection of 50 lines with the stochastic. And, to make the entries quite accurate, you simply need to take a sufficiently long period of indicator:
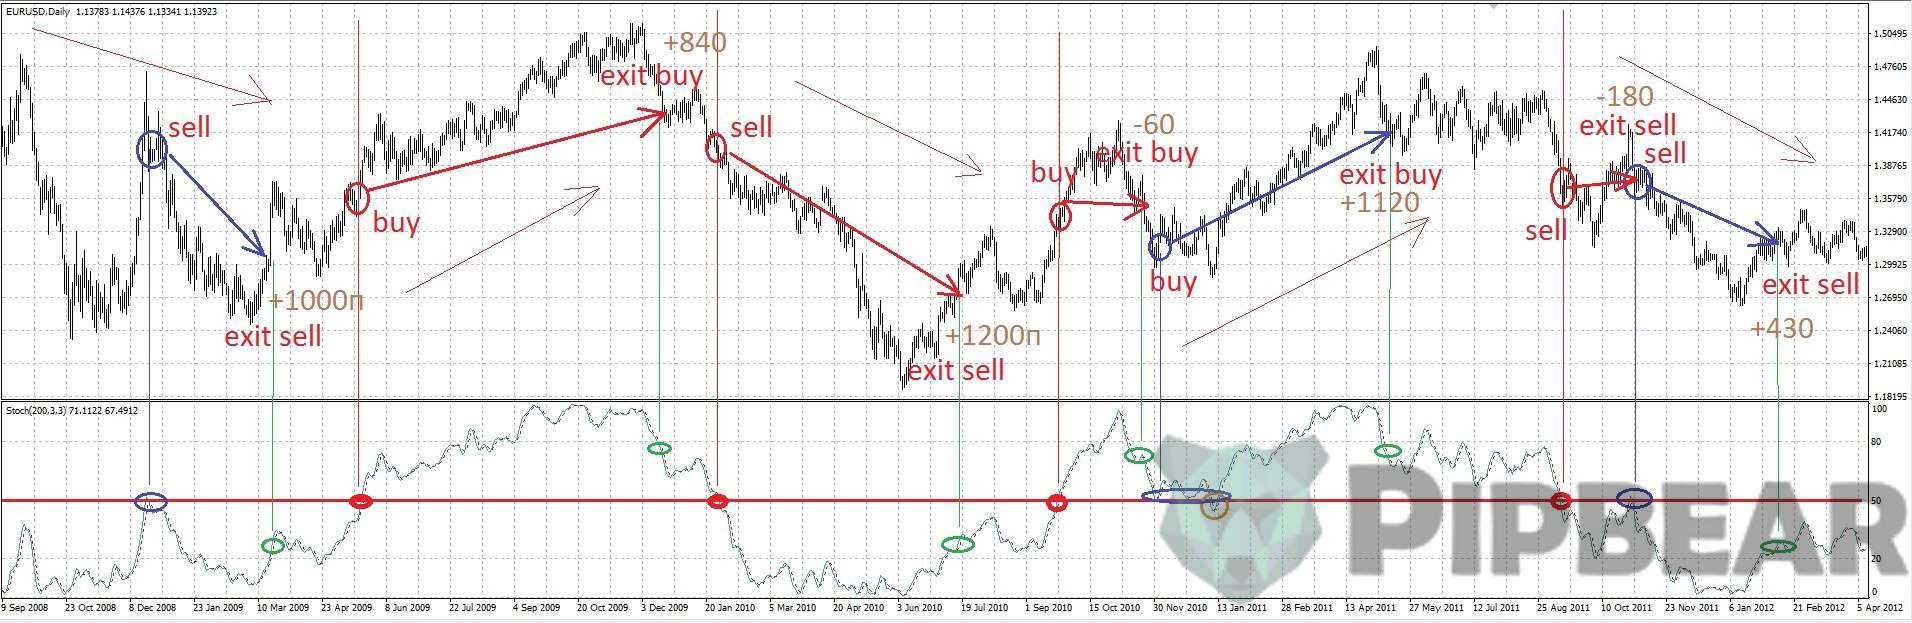
As you can see, just the option of using this indicator can already be a quite profitable trading strategy. In the picture above, the red circles are intersections of the indicator and the 50 line, the potential trade entries The green circles are the recommended exits from the transaction (exits from the overbought/oversold zones). The blue circles are the option of an additional entrance to the position at the reversal from the 50 level (entrance after crossing the main and signal lines). The orange circle (the only one in the picture) is a false signal that could lead to some losses, which are nevertheless fully covered by profit. Trades on the example for the period from January 2009 to February 2012 on the daily chart currency pair EUR/USD brought a total of 4350 old points, which means that with the deposit of 1000 dollars and trading with a fixed lot of 0.1 for these three years will bring 4350 dollars in profit with a maximum loss of $180.
But the point is not in numbers, but in the fact that any way of stochastic trading with the right approach, patience, and consistency, can bring profits. Pay attention to how simple this TS is, even if it does not claim to usefulness and was born in my head after 3 minutes of looking at the Stochastic indicator chart.
- The intersection of the main and signal lines
The main signals of the stochastic oscillator are lines %K and %D crossing. Any intersection should be analyzed within the zones of overbought/oversold.
There is the right-hand and left-hand intersection of lines:

The figure above on the left shows the left-hand intersection, the right one shows the right-hand intersection. The right-hand intersection is considered as more reliable.
There is one more interesting feature of the analysis of main and signal lines’ intersection – a failure when trying to exit from the zones of overbought/oversold. In the picture below there are two such cases, which usually lead to a further prolonged rise or fall (fall, in these examples). The main line crosses the signal one in the overbought/oversold zone and then reverses: bulls/bears did not have enough power. As a rule, the indicator continues to move within the zone for some time, while the price continues its movement. To avoid such cases while applying any of stochastic signals, I always recommend to wait for the indicator to quit the zone.

Once I saw a whole trading system based on this little secret of using stochastic, where the trader was trading quite well (unfortunately, I do not remember the details). I am sure, very few people would come up with such use of the indicators. By the way, this version occurred to a trader known as Alexander Elder. In one of his books he calls this technique “stochastic jump”, explaining this phenomenon by the last price impulse before the trend change.
It is also worth paying attention to the shape of the minimum and maximum of the indicator in overbought/oversold zones. If a minimum is sharp, bulls are strong, and the motion will be rapid, if it is rounded, the upward movement will be slow.

In the picture above, wide reverses are highlighted with the red color, the narrow ones are highlighted with the green color.
5.Stochastic lines direction
Typically, Stochastic fluctuates from overbought to oversold and back. Also, it often changes its direction near the level of 50.

That is, it turns out that, if stochastic came out from the oversold zone, it is likely to reach the level of 50, and, possibly, 80.
Also, when leaving the overbought zone, the indicator is likely to reach the level of 50, and possibly the level of 20. Accordingly, when the stochastic has upward direction on the daily timeframe, and it’s located between 20 and, say, 30, it is logical to assume that the indicator will reach the level of 50. For the D1 period this indicator move from 20 to 50 may take a couple of candles, but om the H1 timeframe this movement will look like a full-fledged trend. I hope you get what I mean: it is possible to predict the price movement in the earlier periods, analyzing the direction and position relative to the older levels of the stochastic.
Another option is also common: when reaching the 75 levels on the daily charts, a trader is looking for a point of opening long on the hourly chart. With high probability Stochastic on the daily charts will reach the level of 80 and above, which can bring significant profits on the hourly timeframe. According to Jake Bernstein, half of the strong market movements have occurred when the stochastic crossed barriers of 75 and 25.
Using stochastic with other indicators
Stochastic is recommended to be used with the RSI. Since Stochastic is faster, it delivers signals before RSI does, but the signals are considered to be less reliable. With the combination of RSI and stochastic, you can filter out weak signals. Stochastic is also recommended to be used with trend indicators (in fact, all oscillators).
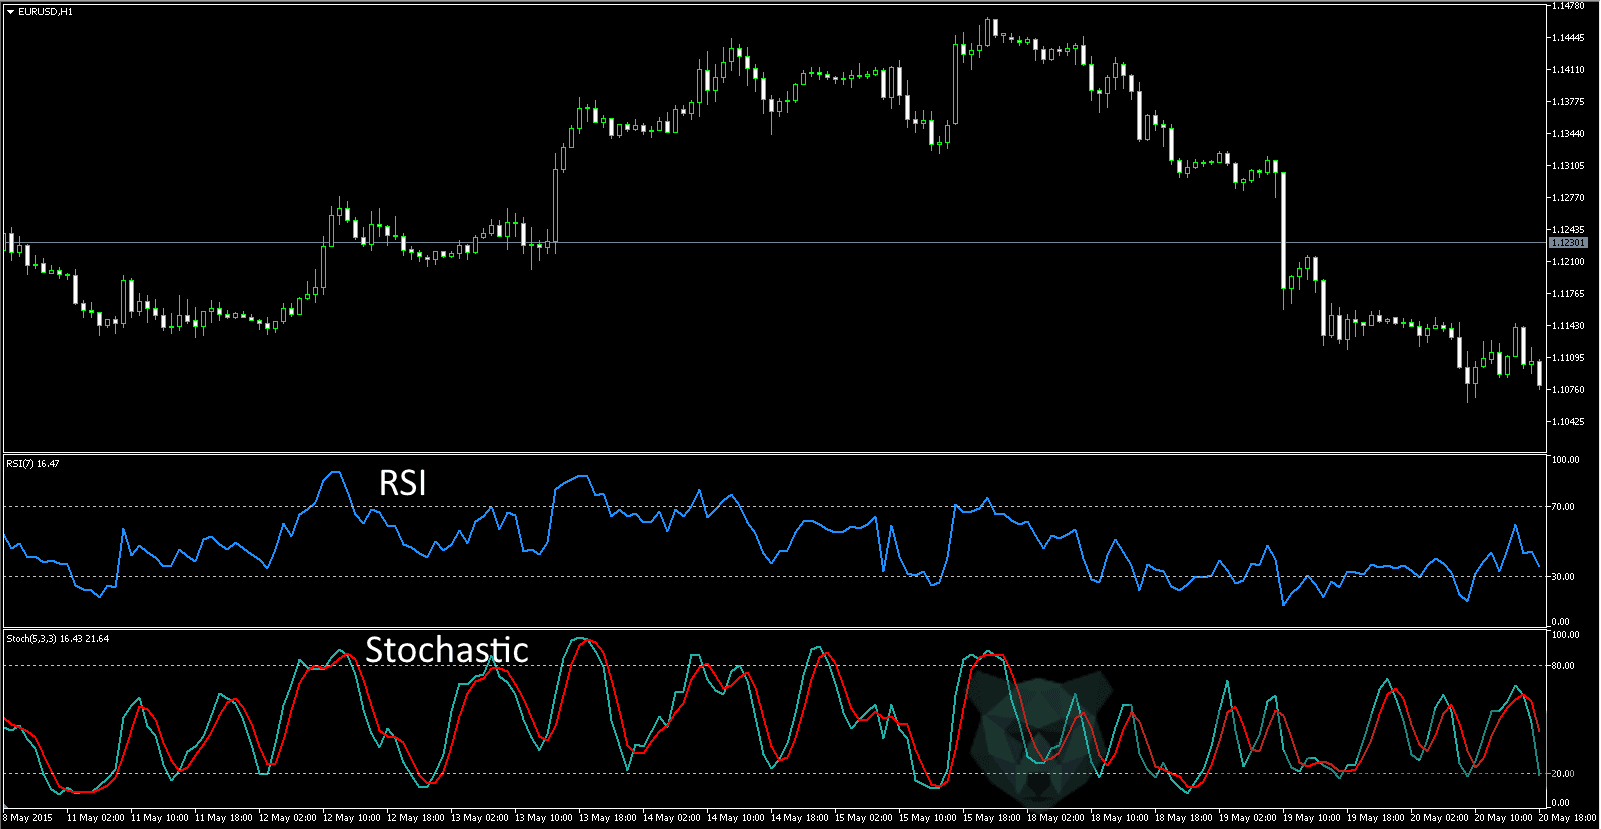
The figure below is a simple trend system, implying entrance by the current trend on a rebound. The presence and direction of the trend are determined using Bollinger Bands (100). If BB is growing, and the price is near the top of BB, the trend is upward. If the BB is inclined down and the price is in the lower part of the BB, it is a downtrend. At the same time, the entrance to the market is carried out on a rebound to the median BB line. If the price is moving inside the BB from the lower to the upper border, the trend is sidelong, and you can enter from the BB borders.
Trades are filtered using the RSI indicator (7) and the Stochastic Oscillator (14,3,3). On the part of the trend at the rollback to the middle BB line, both oscillators must be in the overbought zone for the downward trend (oversold for an uptrend). When exiting the zone, the order is executed.
Pay attention to how the oscillators filter every price approach to the center BB line, preventing early entry into the position. At the same time, the RSI filters stochastic readings.

Conclusion
Stochastic is undoubtedly one of the most popular indicators, but, like with the rest of the indicators, it is necessary to be able to properly and appropriately use it.
Today I have analyzed different ways to use this wonderful indicator, proposed several options for basic trading systems with its use, which, I hope, will help you to develop your trading system. Of course, there are billions of nuances of the application of this indicator in Forex, but it is simply impossible to analyze them all in one article.


Very useful information, got to salute your selflessness…
I am from Singapore, was wondering if you have a meet up session to trade together?
Nice insights. I used the bollinger bands together with the stochastic to better place quick trades. I do 1 min expiry. And its good. Bollinger bands avoids me doing mistakes on just riding along any overbought and oversold signals
i like your way to explain . its easy and quick. i have question if you dont mind to answer .. what time frame is the best for using this statergy.
‘ve been following your educative videos and I want to thank you so much for it. Please I have a big problem and it’s identifying major support and resistance areas please what do I do?
Hi Coach, are the stuff you’re teaching equivalent to those expensive FOREX trading courses? I’ve been learning a lot from you and been asking myself if it’s the same as getting signed up for one of those courses?
Excellent
very very knowledgeable
Fit for me and my trades