The traders face a list of the tasks to be solved before entering the market. Determining the trend direction is one of the first tasks of the list. Moreover, there is no one common solution on how to determine the currency pair trend at the moment.
Before reading the article and writing your questions in the comments section, I recommend to watch this video. It’s not long but covers the biggest part of questions on the topic.
The thing is that each trader chooses his timeframe, which determines the trend. In other words, someone determines the long-term trend for entry with the large Stop Loss order and distant targets while the others are looking for the short-term trend for a quick entry with the small Stop Loss order and the same short Take Profit order. After all, whatever trend you are determining, or whether it is the short-term or long-term trend, you will use the same tools. Yes, today we are going to discuss the trend indicators.
Table of Contents
SIMPLE MOVING AVERAGE (SMA)
This indicator got incredibly popular in the early 1960th. Calculation simplicity made it convenient in the era when the computers didn’t exist.
SMA is the direct price average (mostly the closing prices) over the N-periods in the window. The Fibonacci numbers as well as 14, 50, 100 and 200 are most often used as the period. While eliminating random fluctuations, the moving average shows the market mood by its inclination. You can consider this indicator a lagging one by its formula.
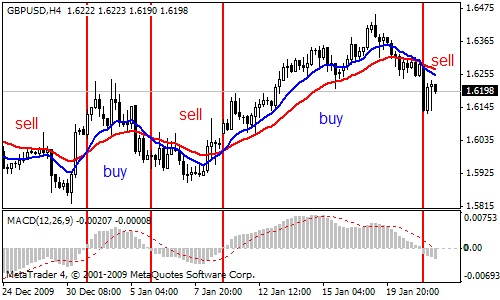
You can determine the trend in the following ways: on the incline of the MA (if used one) or by reverse of 2 or more MAs in one direction. It can be applied to large timeframes.
Fig. 1. The trend.

Fig. 2. Flat.

- Trading signals: open long when the SMA inclines up and the price starts to rise from its MA. Open short when the SMA inclines down and the price starts to fall from its MA. The SMA is a kind of the support/resistance line for the price.
- Also the traders often use the crossing of 2 or more SMAs to enter the market. However, such signals will be false on the flat marker so we don’t recommend you use it. We also don’t recommend to trade when the price crosses its Moving Average.
- Benefits: simplicity of calculations. It is convenient to use on the good trend movement.
- Shortcomings: the indicator often works out too late. The SMA inclines sharply when it goes beyond the average price area. It also provides quite a lot of false signals on the flat market.
MACD — MOVING AVERAGE CONVERGENCE-DIVERGENCE
The indicator was developed by Gerald Appel in the 1970th.
The indicator represents the difference between two Moving Averages in the histogram form (the bars above or below the zero level). In most cases, the traders apply the exponential MA (EMA) on the closing prices. Also a signal line should be put on the indicator to provide signals to enter the market or to indicate the trend change/slowing down.
Determining the trend:
You may apply at least one of three ways to determine the trend using the MACD when it is:
- Above/beyond the zero level.
- Incline (the bars are going high or low. In such cases, the traders use the colored MACD to see the bar, which is longer/shorter than the previous one).
- Crossing the signal line.
The traders often use the last two ways to align with the first one as the main filter of the false signals (on the senior timeframes).
The same signals are used as in case of determining the trend as well as divergence (used on the junior timeframes).
- Advantages: the use of the slow and fast EMAs allows you to see a trend change earlier than in the case of using just one EMA.
- Disadvantages: the indicator often works out late. It’s quite difficult to use it on the flat market (see figure below).
Fig. 3. Trend.

Fig. 4. Flat.

ADX — AVERAGE DIRECTIONAL MOVEMENT INDEX
This indicator is based on the concept of the Directional Movement. Directional Movement is a part of the current day’s price range, which is beyond the previous day’s price range.
The average directional index shows us how much the current day’s price range exceeds (both up and down) the price range of the previous day and averages these readings.
Calculating the ADX indicator seems to be complicated at first but if you make every step of the calculation, you will get the logic and principle of the indicator’s work and signals. Read Welles Wilder’s book “New Concepts in Technical Trading Systems”.
Let’s talk a bit more about the indicator’s characteristics.
Determining the trend: the ADX indicator is good enough for the strong trends when the DX (Directional Index) value increases (see the figure below). It also provides good quality signals when the new trends appear after the flat on the market. The directional index starts to rise from the level of “15” and the trend shows the line +DI or -DI.
Fig. 5. Trading within the trend

Fig. 6. Leaving the flat market

- Trading signals: the directional index rises. Open long if +DI is higher than –DI. Open short if the +DI is below the -DI.
- Advantages: the indicator provides real information if there is a trend on the market.
- Disadvantages: the main disadvantage of the indicator is that the readings produced on the price reversals and the flat. This indicator works out too late and you will see it if you create it by the formula in MS Excel, for example. If you want to cut off the flat to avoid the false signals, you should raise the DX from 15 to 20 or higher. However, you can trade within the flat to your benefit. When the DX falls and the +DI and -DI often meet one another, we can be sure that the price is flat.
BOLLINGER BANDS
The indicator was created by John Bollinger in the early 1980th as a kind of the price envelopes and as a trend indicator. Kill two birds with one stone.
The indicator is created using a Simple Moving Average with a period of 20 and two lines placed from the SMA (20) by two standard deviations of the price from its MA with a period of 20. The idea is to create such a price envelope, which would change along with the price volatility change. Here comes the features of BB: the band expand at the strong trend, and go narrow in the flat. This is not physics :), this is mathematics! If you look into the indicator formula in Excel, you will get why the bands behave that way.
In other words, John Bollinger proposed a brilliant price envelope with dynamic boundaries.
To get all the information on the indicator, we recommend you to read the book “Bollinger on Bollinger Bands” by John Bollinger.
Determining the trend: to determine the trend by this indicator, the traders apply the SMA (20) incline. Moreover, Bollinger suggested studying price reversals in the form of the M and W zigzags.
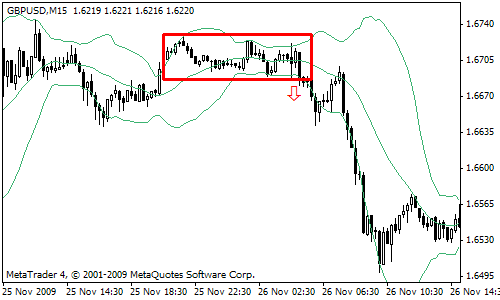
Trading signals: open long at the uptrend when the price falls below its Moving Average and approaches the lower boundary of the envelope. The signal to open short is the opposite. You may also enter the market at the flat boundaries breakout when the bands have converged, i.e. the market in a narrow range.
Fig. 7. Trading within the trend on the pullbacks

Fig. 8. Trading while leaving the flat

- Advantages: it provides good entries to the market on the pullbacks. The transaction doesn’t remain in the read for too long if the trend is confirmed since the trader is interested primarily in the pullbacks while trading within the trend. To leave the position, the opposite boundary of the envelope is used. It is convenient to use on the flat market while working from border to border as well as to breakout while leaving the flat.
- Disadvantages: trading on the trend reversal. You may enter the market on the old trend since you consider it a pullback. However, it is the first wave of the new trend. You may also miss the signals to enter the market at a strong trend with no pullbacks. It provides false signals at the expanding flat.


Thanks for sharring
Sir kindly share the indicator
Thanks for showing this great tutorial to us. It is really a fun time watching it.
very good and helpful resource especially for new traders like me.
A very helpful video
Can I use this one for gold and related commodities?
My knowladge has increased about forex by this piece.
Yes, keepup the good work