

The essence of the Trend Lines Auto Indicator is the analysis of the data received from the stock exchange and automatic creation of the charts that display this data in the form of the trend lines. You can apply all types of charts on the NinjaTrader charts.
So you do need to pick the brokers able to work with this trading platform. It displays the indicators of any currency tool at any timeframe so the chart must support it. You can set any timeframe when the chart is being created. You can pick one hour, two hours, a day or 5 minutes. It doesn’t matter at all. However, experience has proved that if you set 15 minutes to the chart, you will get accurate results.
If you don’t like the way the trend lines are set, you can easily change it. To do so, you need to find the section containing the indicator parameters. It is not shown on its own on the chart. However, its values are important for building the trend lines as they are built upon its tops and bottoms.
Therefore, you can be sure that the slower the ZigZag is, the more time it takes to create the trend lines and the more bars will be required from history.
Description and performance of the Trend Lines Auto Indicator
I should warn the budding traders that you would need more than just an indicator to start making money on Forex. The Trend Lines Auto Indicator is not a complete trading strategy. You should apply additional filters before entering the market. That will significantly increase your chances to get a profit.
Let’s talk a bit about the algorithm…
I should say from the start that this indicator must be used in the context of classic trend trading. A trend stands for the price movement in a certain direction over a certain period. You can perform both uptrend and downtrend trading.
There is also such a thing as the sideways trend, which means a controversial situation when the price is very unstable and goes up and down. It happens quite fast and often so it’s not possible to determine the exact type.
traders significantly reduce the transaction risks by following the trend lines. It’s of no surprise that most people try to trade following the trend’s direction.
When the price passes right through the trend line, the Trend Lines Auto Indicator will immediately emit a certain sound. You may add a special information window to the sound notification. It will notify you about a new trading signal.
When the trend line is broken out, a trader should open the positions towards the breakout. It would be good to enable the option of drawing the arrows. They can make it easier to find the point of the signal appearing on the chart. Such additional options, of course, are not necessary but can significantly simplify the work of the traders who use the trend lines and the horizontal levels.
The Horizontal levels is a way of determining the price movement direction. These changes are chaotic and hard to understand. The method of horizontal lines is designed to determine such moves. If you examine the chart carefully, you will notice that the price comes back and forth at some levels.
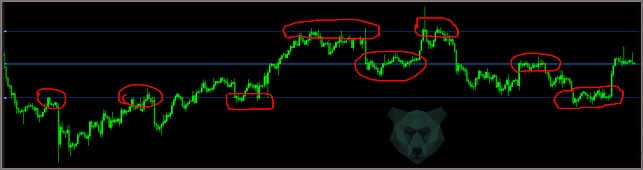
Concurrently the price often breaks out the line or holds on it for a long period. We may combine such moments and get a horizontal level.
Let’s get back to the indicator. The Trend Lines Auto Indicator is based on the NinjaTrader7 trading platform. For shortness sake, we write the version of this platform as NT7 and the earlier version as NT6. The tickers we use in work are provided by the broker.
The Trend Lines Auto Indicator has the following parameters:
- Break – a sound signal. It depends on the chosen trading style.
- True – the breakout of the trend line.
- False – a bounce from the current trend line. It happens often when the value gets lower the line.
- Expand – a simulation of the second line of the indicator.
- The UseAlert – a sound notification generated when the indicator’s line is crossed by the price.
- AlertDebug – making a record on the sound signal to the journal.
- АlertSound – turning the sound on when the trend line is crossed.
- AlertMessage – display of the information window while giving a signal.
- FileSound – the name of another file that will be used when giving a signal.
- TrendUpName – the name of the support line.
- TrendDnNam – the name of the resistance line.
- trend – the color of the support line.
- Brendan — the color of the resistance line.
- Otstup – the distance (in points) between the signal pointer of the system and the chart line.
- ExtDepth – the value of a standard ZigZag indicator. The program also has two standard options, which are ExtDeviation and ExtBackstep.
Conclusion
The Auto Trend Line Indicator does not require any complicated manipulations and is very easy to install. The main thing is to follow the standard instructions. The budding traders often prefer to start working on Forex using this algorithm.
Many people believe that making money off the stock exchange is very easy. However, they are grossly mistaken. The trader’s profession is difficult and requires a lot of training as it is not easy to monitor all the price changes on such a large-scale action field. In general, far from everybody can predict further development of the trend.
In addition to knowledge, a trader must have well-developed intuition as well. However, the systems such as the Trend Lines Auto algorithm can significantly simplify the task.
However, if you have jumped to the deep end and failed because of a lack of knowledge and skills, do not blame the program for its inefficiency. Only users are responsible for the final results, not the equipment. Remember that trees bear fruits only in the right hands!


how can i get this indicator?
how can i get this indicator?
What are the backtesting results for this?
Thanks for this very well explained indicator
Trend lines are obviously good, I have been making use of them for a while now
Aw Wow Thanks Be Super Awesome
do you have a myfxbook to view your live trading results?
How can I join your course
Thank you for the service to us all
Very understandable and useful content
Thanks for the nice explanation, but my concern is to read the chart of a stock , is it absolutely the same way o if there is any change or different way to look at it?
THANKYOU SO MUCH, YOU EXPLAIN IN A WAY I CAN UNDERSTAND IT …LOVE YOUR WORK
I like your tutorials, it’s easy to understand for me, your videos really helping me to learn. I’ve a question for you, some people using some kind of app “swipetreads” they saying just copy and paste information from the app, is it reliable?
Really useful, clear and concise tutorial! Thank you!
Dude you are awesome! Thank you!
could you possibly do a video focusing on just oil. oil etf s. news. and etf s shorting oil such as sco (all time low)
Can you please tell me where do you get latest Economic news which really happens and which one is really important and affects a lot on charts, on volatility and all trading system together. Thx
Well done!!!