

Trend reversal indicators confirm the reversal signals generated by graphic patterns. Unfortunately, there is no such thing as a 100% accurate reversal indicator. Otherwise, traders’ lives would be too easy.
Before reading the article and writing your questions in the comments section, I recommend to watch this video. It’s not long but covers the biggest part of questions on the topic.
The Forex market cannot be accurately measured by indicators. It’s too complex for that. That’s why we’ll be using reversal indicators to calculate the probability of a reversal in certain spots.
The first indicator we’ll use to determine the probability of a reversal is Moving Average.
Table of Contents
Moving Average Indicator
If you’re only using one MA line, prepare to deal with plenty of false signals. On the other hand, multiple MA lines (a so-called “fan”) make up a pretty reliable reversal indicator.
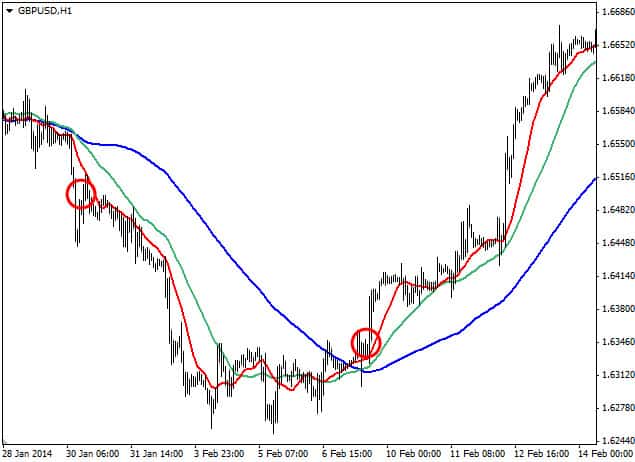
On the chart above, you can see three simple МАs with different periods: 100 (blue), 35 (green), and 15 (red). The 100-period blue МА on Н1 timeframe shows the overall direction of the GBP/USD price. However, the price has broken the МА (100) multiple times confusing the trader and providing false reversal signals.
To get a more precise picture, we added two more MAs with the periods of 35 and 15. Now we can outline the reversal signals:
- If the bar closes below МА (100), МА (35), and МА (15) and the fastest MA is below the slower MAs, this is a bearish reversal signal (i.e. the price is about to go down). See the bearish reversal in the left part of the chart.
- If the bar closes above (100), МА (35), and МА (15), and the fastest MA is above slower MAs, you should go long. See the reversal signal in the right part of the chart.
If you apply the MA fan on your chart, the indicator will signpost the beginning of a strong trend. However, the MA fan also generates false signals when the price goes flat. Another problem is that the MA fan provides scarce reversal signals, hence money-making opportunities are few.
MACD indicator
While MACD can’t hold a candle to MA in indicating trend reversals, it’s good at showing the strength of a trend and trend cycles.
On the H4 chart below, you can see MACD (5,100,5) for the EUR/USD currency pair. The green histogram and the red dotted line crossing the zero level is a good reversal signal.

Note that the zero level must be crossed by two lines, the main (green) one and the signal (red) one.
If the green histogram crosses the zero level but the red line doesn’t, you don’t open a trade.
Take a closer look at the chart above. A reversal signal occurred at midnight on May 9, 2014, and held till 8 pm on June 19, 2014. The downtrend that followed the MACD signal could have earned us 200 pips.
It’s important to understand that the MACD indicator is not a perfect tool. It has its fair share of disadvantages. For example, it generates lagging signals and reacts to false breakouts. Despite all cons, MACD will make a great addition to your trader’s toolbox.
Stochastic Oscillator
The third reversal indicator on our list is the Stochastic Oscillator. The Stochastic indicator is good at indicating the beginning and end of a trend. It provides reliable reversal signals.

On the chart above, you can see the Stochastic (250,3,3) line for the EUR/USD currency pair. As you can see from the chart, Stochastic predicted the upcoming reversal with a high degree of accuracy.
By crossing the levels 80 and 20, Stochastic (250,3,3) signaled that the bearish trend was transitioning into a bullish one.
Note that an entry signal had occurred on January 24, 2014 and held till Stochastic (250,3,3) crossed the 20 levels on February 5, 2014. If we opened a short trade, we would have made about 150 pips.
The best thing about Stochastic is that it’s highly sensitive to a price changing its direction. See for yourself! The short entry signal by Stochastic was more accurate than the one provided by MACD. Plus, Stochastic provided the exit signal when the price was about to reach its lowest level.
Alligator indicator
And last but not least. The Alligator indicator is plotted as three MA lines. These lines are known as the jaw, teeth, and lips of the alligator.
- Alligator’s Jaw (blue line) is a 13-period MA shifted 8 bars forward.
- Alligator’s teeth (red line) is an 8-period MA shifted 5 bars forward.
- Alligator’s Lips (green line) is a 5-period MA shifted 5 bars forward.
As you can see from the chart, the Alligator indicator looks a lot like the MA fan.
The Alligator indicator provides the same entry signals as the MA fan:
- Long entry: the price is above the Alligator’s jaws, teeth, and lips.
- Short entry: the price is below the Alligator’s jaws, teeth, and lips.
For a more reliable signal, you should wait till the Alligator’s jaws and lips move further apart.
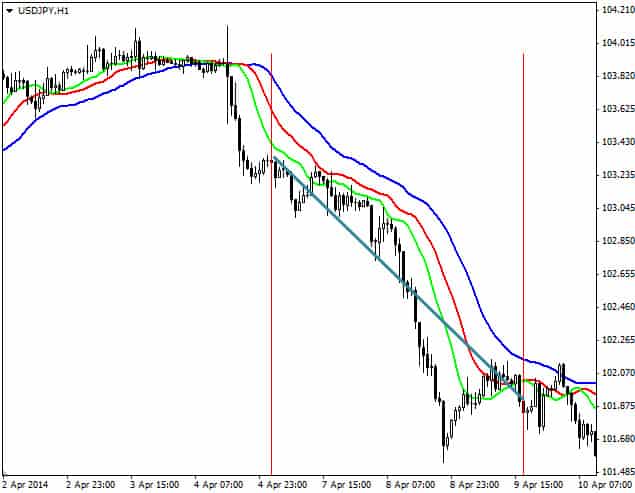
On the chart, we opened a short position for USD/YEN on April 7, 2014 and close the trade after the Alligator lines intersected (the signal that the downtrend was losing steam). As a result, we earned 175 pips.
The difference between the МА fan and Alligator is that the latter is one indicator consisting of 3 MAs while the former consists of three individual indicators. Furthermore, Alligator has built-in price shifts for all three МАs. And lastly, Alligator is a more visually friendly tool. (Although it’s a matter of taste.)
If you add the shifts to the MA, you’ll get the Alligator indicator.
Along with the default reversal indicators which are built-in МТ4, you can use other reversal tools available online.
Don’t get your hopes too high, though. There is no such indicator that would predict a market reversal with a 100% accuracy. Instead of showing the exact reversal spots, reversal indicators only signal the probability of a reversal.
Many beginning Forex traders confuse graphic analysis (price reversals) with indicator analysis (trend reversals).
A trend reversal can be identified by price reversals. Traders use reversal indicators to confirm the mathematical probability of the beginning or end of a reversal.
A trend reversal includes 3 phases:
- The price breaks the support/resistance level.
- The price continues to move below/above the support/resistance level.
- The price starts to move in the opposite direction.
Summing up, it’s safe to say that any reversal indicator signals the breakout of a support level. However, this doesn’t automatically mean a trend reversal. To avoid such traps, a trader must first read graphic patterns and only then look at reversal indicators.


