

Today we are going to discuss the so-called Horizontal Volumes that help us to determine the most interesting price levels for the large players. This is an auxiliary tool that can be combined with a variety of strategies.
Before reading the article and writing your questions in the comments section, I recommend to watch this video. It’s not long but covers the biggest part of questions on the topic.
Table of Contents
Market Profile or the Signal That You Have Lost
The idea of the Market Profile traces its roots to the 1980th. Peter Steidlmayer along with the Chicago Mercantile Exchange were developing this idea.
The traders using the Market Profile can understand the market much more deeply. That results in a more comprehensive understanding of the price movements in the market over a particular period and in general.
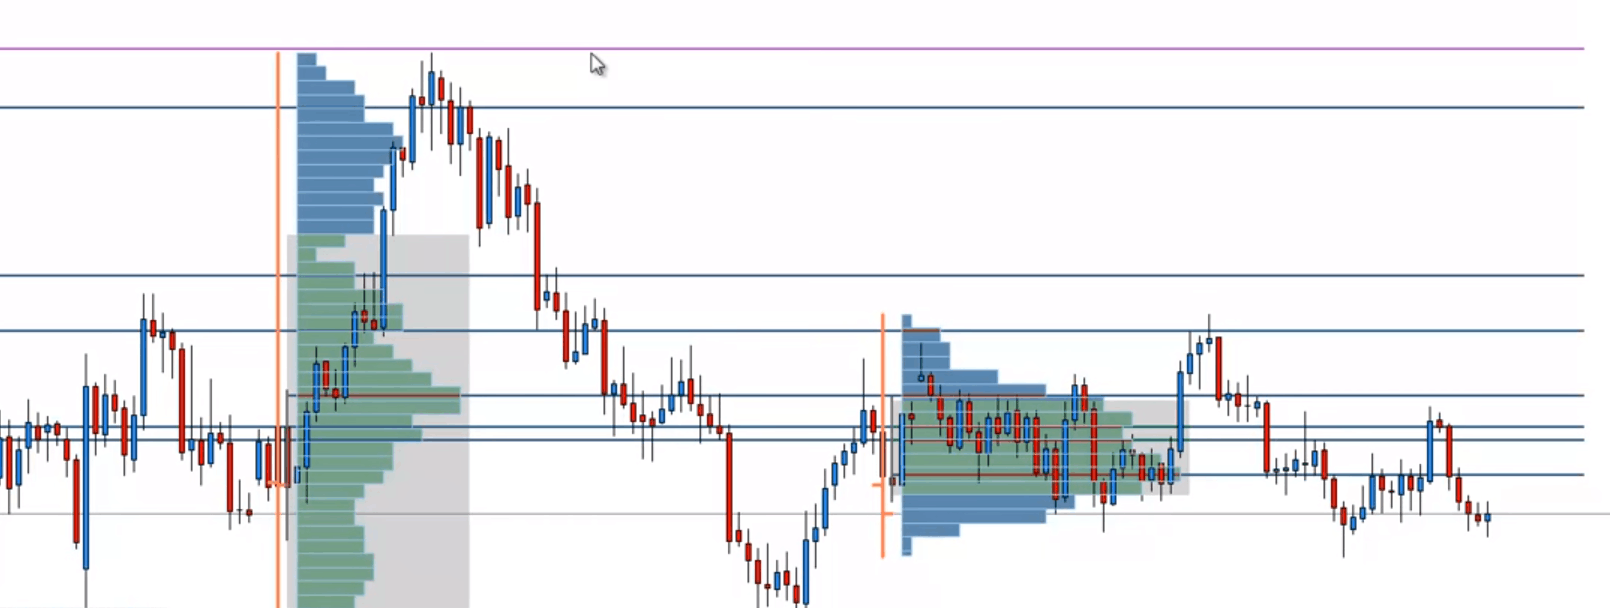
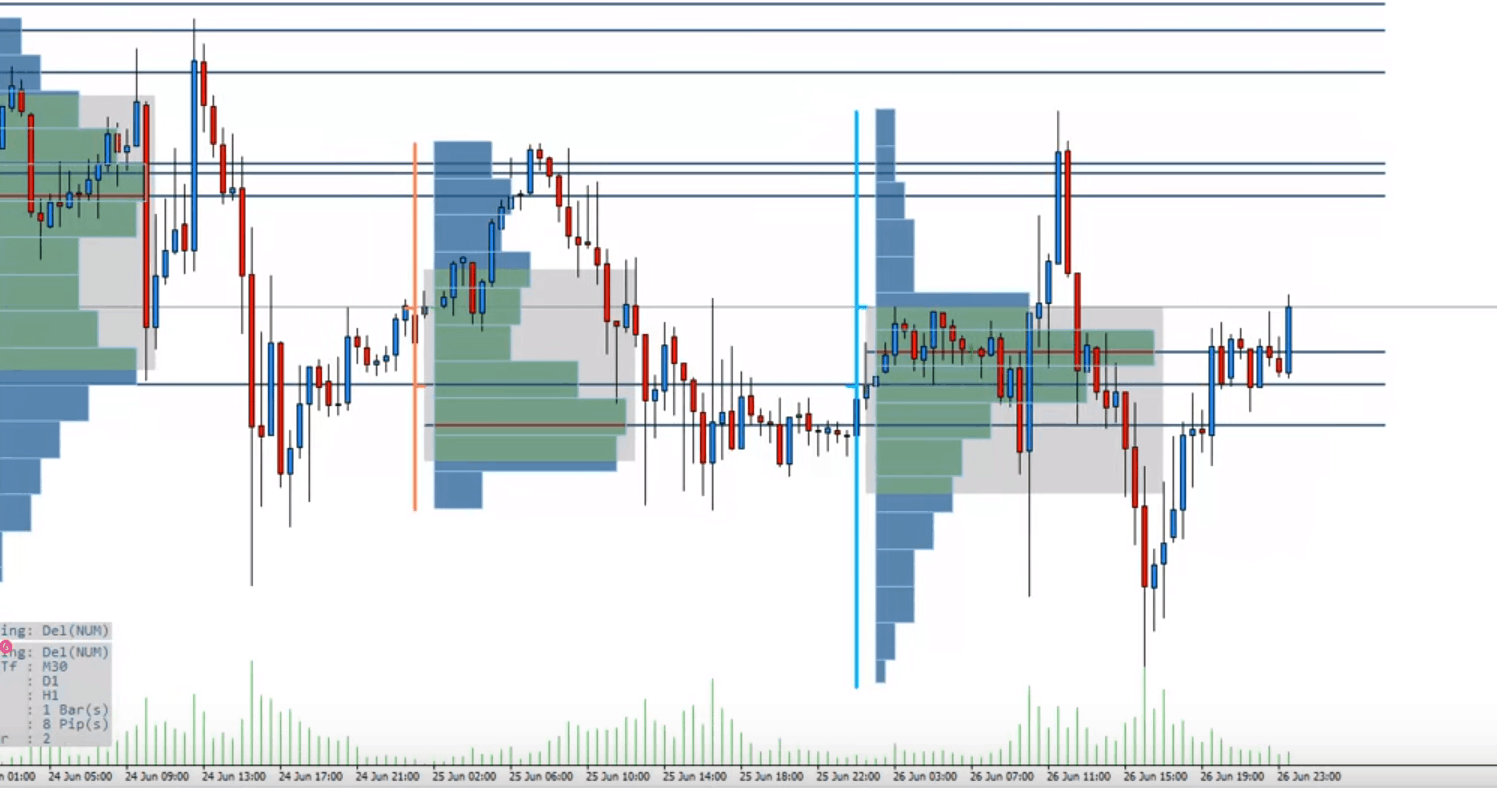
So what is the Market Profile? This is a price area, which represents a certain equilibrium zone containing an equal number of the buyers and the sellers.
The normal distribution curve shows us that the price changes on the market happens in the form of a bell-shaped line. In turn, the price location relative to this curve is the information that we need. In simple words, the Market Profile is the horizontal volumes consolidated at each price and the line size shows us how the volume that has been traded at this price. That is, the price starts to move but it requires the fuel, which is the simple traders (the so-called “crowd”). We and all the small organizations with small deposits are the fuel.
A large player must accumulate a position and therefore he will push the price through a certain level to get a position there because he cannot just press the “Buy” button and get a thousand lots position. He will never get enough liquidity so his purchase will stretch over a large price range and he will eventually earn nothing. Therefore, such players usually get their positions are in the flat (when the price moves within a certain price range and does not go beyond it). So both the buyers and the sellers are to be deployed in there. After the required volume is obtained, the true movement finally occurs.
As you can see, the indicator marks the maximum volume (you can download the indicator at the end of the article) as well as the volumes smaller than the main one but still large enough for this range.
Difference between the Horizontal Volume and the TPO Market Profile
The Market Profile is very similar to the TPO Market Profile though they stand for different things. If Volume Profile is the volume graduation for each price, the TPO profile in simple words (time, price, opportunities) is the area, in which the price has spent most of the time.
Each letter stands for every new 30-minutes period in this profile. If any price range was traded over the particular half an hour, it is indicated by the corresponding letter and this letter will be put on the chart at the level of this price range. You will see that most of the letters will be on the areas, at which the price has stuck for the longest period. So you can determine the price range, which was the most interesting to the market players. That is the trading area that has had 70% of the daily volume.
We shall use it the same way as in the case of the Market Profile. We shall trade in the direction of the price going beyond accumulation. It looks almost the same on the MT4 platform as it does in the Market Profile.
Practical Use
How do we apply this knowledge? In simple words, we should open the positions in the direction, in which the price goes beyond the profile. However, we know that there is no Holy Grail so the Market Profile should be used as the direction filter for entry. Let’s exemplify this idea. If the price is above the profile and you are considering a scalping deal, you should look for buying. If it is under the profile, consequently you should look for selling.
There is a term POC (point of control) in the day profile. This is the highest volume of the day traded at a certain price. (Look at the screen of fusion 6E-euro-terminal SB_Pro)
Why the profile is so good for the scalp and intraday traders? Let’s think. You trade every day and try to close the positions every day except for force major cases. Therefore, every day starts truly anew. So you look at the maximum volume of the previous day and watch how the price reacts to it. If the price has gone below it, then you should be thinking about selling and look at the present-day profile formation. We should also remember to monitor how the price reacts to it. If the price has formed a new profile and gone below it, we should continue to sell. If it has gone above it, we should buy not exceeding the previous day maximum volume of the profile.
What if you are not a scalp trader and all you want is to “stock up” for at least a week? You should take a longer period and form a profile for each day on the chart and at least a two or three days general trade on the sideways. So where is the price now relative to the general trade? After that you can decide on entering the transaction. However, long periods won’t still work as the price movement can increase both in buying or selling, or distribute along its movement in the semiannual period.
A trend is not something limitless. If the books wisdom is true, the market remains flat 70% of the time. And that’s where the Market Profile comes to our aid. It allows us to trade both on the trend and the flat markets.
Determine and trade the borders of the volume micro-channel. The advantage of this type of trading is that there will be a very short stop order, which will bring a good risk/return ratio.
Determine the borders of the volume micro-channel. As soon as the price goes beyond it, you may enter into the transaction. It has significant pluses as you can get a good trend movement of 90 pips in just one day (look at the screenshot below).
Conclusion
The Horizontal Volume can be a useful thing for determining the main trend movement of the day. However, you should always remember that it is not a separate strategy but just an auxiliary tool.


I try to just concentrate on volume and price action so Volume Profile is an interesting addition
Well thought out structure and great skill sets taught, made a difficult subject easy to understand for noobs to volume profile like me thanks a lot
thanks for sharing this! If one has to do a deep dive in Volume strategies, is there a book (bible) one can refer to?
Should we need any other indicator in combination with this ? Or its just support resistance self made drawings ?
Very happy to have found you
Brilliant. You have a very good way of teaching things
What time frames do you recommend for day trading and week/month trading? ie 5m or 4h or 1D charts? And how should you stretch or zoom in on these charts across the screen for most accurate VP readings?
Thanks again – Its great to learn from you
Thankyou again.. love it.. very very good explaination again.. very eye opening thanks very much 🙂