

What is algorithmic trading? The term speaks for itself but it’s still worth giving a detailed explanation.
Algotrading is a trading style whereby a trading algorithm, which includes the rules for opening a position (trading signal), keeping a position, closing a position, risk management, etc., is implemented through software.
The algorithm connects to a platform (or directly to an exchange), gets activated, and follows the rules contained in it. However, most algorithms are less sophisticated. They include entry/exit rules and risk limitations (which, instead of limiting risks, often leave a trader without a cent).
The Internet offers a big selection of Forex advisors that include trading algorithms designed for the MetaTrader platform. Unfortunately, such algorithms feature thoroughly selected indicators with fitted parameters that make the equity line look good. I strongly believe that such algorithms are worthless. Market is an unpredictable flow of information and prices, with no two identical events. This is why I urge you not to waste your time fitting indicators and their parameters using historical data.
Due to technological advances, the use of trading algorithms has greatly increased compared to the early ‘00s. This is bad news for basis traders. Due to high-frequency algorithms, low timeframes are getting increasingly unpredictable. The dispersion of financial assets on low timeframes is growing, and shortstops start to generate losses instead of preventing them. My tip to traders is to forget superstitions and start using their brains. Nowadays, institutional market players accumulate large trading volumes by using special algorithms, such as TWAP, VWAP, etc. As for medium- and long-term traders, they aren’t affected by big numbers of algorithms used in the market because trading on high timeframes is a completely different thing.
Table of Contents
Quantitative trading
What is quantitative trading? What has it to do with algorithmic trading? The category of quantitative traders includes mathematicians, programmers, economists, and the like. They’re involved in looking for vulnerabilities and drawbacks in trading tools and working on a mathematical model that would benefit from detected drawbacks. At the same time, there is a discipline known as econometrics that engages in analyzing and predicting time series.
Needless to say, methods and models they teach students at universities don’t work in modern markets. However, you can’t design an industrial machine without knowing what a wheel or engine is. To create advanced and competitive trading methods, quantitative traders, or the quants, must know the fundamentals of econometrics and mathematical statistics. Quantitative trading attempts to create a market model that would describe the movement of a financial asset. By using this model, you can make accurate forecasts. The quants establish their hedge funds so that they could compete with major banks and other funds. The goals pursued by a giants fund include creating a capital-intensive, stable, and diversified model for managing assets. Such funds attempt to become independent from market cycles, i.e. market-neutral. Now let’s take a look at the structure of a quants fund.
Quants: Positions
A hedge fund needs quantitative traders, quantitative researchers, finance engineers, and quantitative developers. These positions are paid differently and involve different amounts of responsibility.
- Quantitative trader.
In a quants hedge fund, a quantitative trader can be metaphorically called “the tip of an iceberg.” Qualitative traders accumulate trading income for the company. Furthermore, they design algorithms to search for an alpha, i.e. the slightest deviations from the standard price fluctuations in the stock market. Designing such algorithms require knowledge in econometrics, statistical data, and machine learning. To be able to create such an algorithm, you need to have a degree in applied mathematics or artificial intellect. Experienced and disciplined qualitative traders usually have no trouble with promotions.
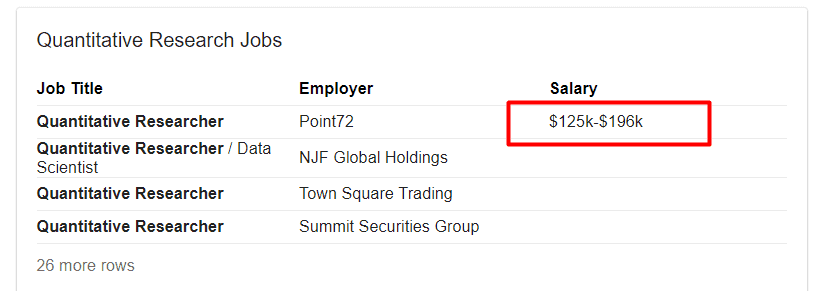
- Quantitative researcher.
A quantitative researcher must be an expert in mathematics or have a doctor degree in stochastic calculations. It’s not uncommon that people with such qualifications work in alternative research companies or large hedge funds, where they can apply more abstract approaches to studying market changes. At the same time, quantitative researchers often work for investment banks.
- Finance engineer.
Finance engineers are also known as “qualitative analysts.” They assess the product before it’s sold to clients in major banks. They need to have deep knowledge of stochastic calculations and risk-neutral probabilities. Plus, they must be able to incorporate the model into the existing library written on popular programming languages. Finance engineers are usually involved in fixed-income industries and finance exchanges with derivative products. Finance engineers are proficient in physics and technical sciences, which helps them implement advanced finance products.
- Quantitative developer.
Quantitative developers fall into two categories. The first category includes people working closely with other quantitative analysts to implement and optimize financial models. This means that they can take the original code on MATLAB, R or even Python and rewrite it on other languages, such as С++ or Java. Quantitative developers usually work in organization and control departments of investment banks. Specialists from the second category work with financial data on price categories and the architecture of different trading systems.
Quantitative developers write code for “raw” infrastructure, allowing quantitative analysts and traders to make money using their models. At a fund, a quantitative analyst may work on “raw” projects involving new trading algorithms. The highest-paying job in quantitative development is a С/С++ developer who is proficient in Unix network programming, low-latency systems, and Core Linux. Such specialists are usually involved in ultra-high frequency trading, where orders are executed within microseconds.

Algo trading strategies
Now let’s look at the most popular strategies used in algorithmic trading and quantitative trading.
- Market making strategies.
I believe that market making is one of the easiest ways to make money in financial markets. According to some “expert” traders, the secret of their success is that they buy an asset at a low price and sell it a higher price. But what is a “low price” and “high price”? Market makers are using the same principle. They buy at a low price and sell at a higher price. At the same time, they don’t care where to buy or sell.
They simply place bids and offers, and if a price goes against them, they increase their lots. You must have noticed that if a high-liquidity asset shows a sharp exponential movement, the trading volume is increasing. These are market makers at work! They average a price until the demand is met. As soon as the rush has faded away, traders start to lock in profits or losses, causing a price to go in the right direction. At the same time, market makers avoid accepting big risks. Before major news releases, the liquidity of an asset may drop because the news may increase volatility and cause big risks for market makers. There is one pitfall, though.
Suppose, you have $10,000 in your trading account. Think about how long you could trade your position if a price went against you? The answer is: not long. If a price makes a strong move, you’ll turn into an ordinary investor waiting for a margin call or for an asset to return to the average price. To be able to profit from a market making strategy, you need to have a fat trading account. This is the prerogative of large banks and funds that are often paid to boost the liquidity of a certain asset. By diversifying their trading portfolio, a market maker protects their account from force majeure situations, smoothing out the dispersion of their equity line.
- Trend strategies.
Trend strategies are popular among both beginning and seasoned traders. Who hasn’t heard tips like “Trend is your friend”, “Avoid trading against the trend”, etc.? When teaching novices, consummate traders talk about the importance of following a trend in D1 and other charts. This is true that a trend tells us how a price is behaving. The problem is that a trend shows us how a price behaved yesterday. You don’t know how it’ll behave tomorrow or the day after tomorrow.
My “favorite” part is when a trader analyzes a trend in the D1 chart but open positions in the M1 chart with tiny stop losses. The thing is we all trade asset volatility. Some traders don’t understand that; others do and choose to trade options. Anyway, all strategies used by day traders work like options. You only make money if you know how to correctly assess volatility. When placing a stop loss, make sure that it won’t be activated by the normal volatility of your asset. Of course, you can’t detect the doings of big market players and limited buyers/sellers until they are willing to reveal themselves. In algotrading, trend strategies vary from simple combinations of popular technical indicators, such as moving average, MACD, etc., to advanced econometric systems designed to predict the drift and volatility of an underlying asset using hundreds of factors.
- Volatility trading.
Since I’ve touched upon the topic of volatility, let’s dive deeper this time. An option is the best instrument for trading volatility. The price of an option consists of two components, intrinsic value, and time value. Intrinsic value is the difference between the asset’s price and strike price. If the profit equals zero or there is a loss, intrinsic value equals zero. This is one of the main advantages of an option.
But this is the time value that makes an option so mysterious and attractive. Time value makes the core of multiple methods designed to calculate an option price. Time value depends on a variety of factors, the second-important of which is Implied Volatility. Trading options, we can eliminate the factor of an asset price and only sell/buy implied volatility. Quants are trading their option models and market makers are trading an underlying asset while doing that in different ways.
- Front running.
For front running strategies, traders usually use HFT (high-frequency trading) because the outcome depends on how fast you place orders. While front running strategies are not complicated per se, you need a competitive edge to be able to implement them. The algorithms place orders in dark pools. Once the order is executed, the algorithms place a counter order a bit farther and wait for its execution. The logic behind this strategy is to benefit from market noise. The problem is that the liquidity of an asset doesn’t provide much information because large positions are executed in dark pools and order sizes displayed in market depth can be just a manipulation and disappear in a second.
- Arbitrage strategies.
Arbitrage trading comes in many forms. Here I’ll talk about spacial, or geographical, arbitrage. A trader spots differences in the price of an asset. For example, you can trade the ETF of Company A and ETF of Company B at the same time. Nowadays, arbitrage trading in developed countries is fully dominated by HFT systems. To compete with them, you need to create a better infrastructure that would allow you to send orders faster, which is impossible. The best part about special arbitrage is that it fully eliminates market risks, i.e. you’re making a small consistent profit.
- Statistical arbitrage (StatArb).
In the finance community, the term “statistical arbitrage” can be used in different contexts. Classical arbitrage (see above) eliminates risk because you buy and sell the underlying asset at different prices at the same time. Statistical arbitrage is a trading system that includes automated trading systems, statistics processing methods, and data mining. Pairs trading is considered to be the predecessor of StatArb.
In pairs trading, you match different stocks. When one of the paired stocks starts moving and the other lags behind, a trader buys or sells the pair’s spread. This is a great strategy to minimize risks. In other words, you’re using countertrend trading or means reversion. You need to create a diversified portfolio with hundreds of stocks. Some of the stocks are kept in long positions, others are kept in short positions. You can use different methods to build your portfolio, including ranking stocks (scoring). Long stocks get a high score. Short stocks get a low score. Since scoring formulas are using mean reversion, stocks with an originally high score may get a low score at the end of the week. StarArb may include any strategy that uses a beta-neutral approach adapted for different assets and statistical techniques designed to generate execution signals. Pairs of stocks can be also assessed independently, i.e. through assessing statistical parameters of the hybrid instrument:
At the same time, statistical arbitrage has its risks. At any moment, there may occur an event that will cause short-term losses. If such losses exceed liquidity, which is currently available to a trader, it may lead to a catastrophe (like with the LTCM fund). Furthermore, StatArb models are not flawless. The thing is that they don’t take into account some factors, considering them insignificant. However, such factors may sometimes affect prices greatly. If a model is based on a false statistical interaction, this is yet another risk. Risks are increasing when plenty of traders start to invest at the same time and following the same principles. This causes deviations from the previous statistical parameters of a spread.
- Basket trading.
Basket trading strategies are similar to StatArb strategies. However, when it comes to basket trading, you build and trade stock portfolios instead of stocks. Also, you can trade a stock portfolio against a financial instrument, e.g. S&P 500 stock portfolio against the S&P 500 ETF. Since you’re trading a variety of assets, you’re diversifying your risks. Based on their mathematical models, hedge funds create trading algorithms that automate the assessment of asset portfolios.
Long Term Capital Management
At this point, you must be thinking, “Damn! I should’ve graduated from the university, become a professor, designed a groundbreaking mathematical model and earned millions of dollars!” I’m sorry to disappoint you but the market can be cruel. Do you know the story of LTCM? Long Term Capital Management (LTCM) used to be a major hedge fund. It was established in 1993 by John Meriwether, the former head of the bond sales department at Salomon Brothers. The LTCM team consisted of top-class traders with doctor degrees and Nobel Prize winners. What could go wrong? In 1991, Meriwether left Salomon Brothers with a scandal. He decided to establish his hedge fund. Why precisely a hedge fund? Compared to other types of investment organizations (e.g., mutual funds), a hedge fund has no rigid requirements as to the number of investors (a mutual fund can have no more than 100 investors) and size of deposit (at a mutual fund, a deposit starts from one million dollars). Furthermore, regulatory and auditing agencies are less controlling when it comes to hedge funds.
In a nutshell, LTCM’s original strategy can be described as the “arbitrage trading of fixed-income instruments.” Using sophisticated mathematical models (what else did you expect from Robert Merton and Myron Scholes?), the fund profited from discrepancies in bond prices (e.g., the price difference between a 30-year bond and a 29-year-and-9-month bond). LTCM specialized in convergence trades, i.e. the fund tracked big discrepancies in bond prices opened a position hoping for a convergence. In 1995, LTCM’s profitability amounted to 43%. In 1996, it was 41%. Needless to say, investors were over the moon and kept pouring money into LTCM! As the fund was growing in size, it started to lack liquidity. In 1997, the interest rate was at 17%, which still looked pretty good and was higher than the bank rate.
When the size of the fund exceeded several billion dollars, the team expanded its pool of strategies (S&P500 volatility trading, merger arbitrage). There was one peculiar thing about LTCM. As each transaction generated a rather small profit (remember that it was arbitrage trading and not trading with a trend), the fund had a huge leverage. In early 1998, LTCM’s size was 4.72 billion dollars. Its positions totaled 129 billion dollars. That way, the fund’s leverage amounted to 26.4 to 1. In the middle of 1998, the repercussions of the 1997 Asian financial crisis affected LTCM’s positions, causing heavy losses in May and June of 1998 (6.4% and 10.1%, respectively).
Algo trading software
In this chapter, we’ll give a brief overview of useful software for algorithmic traders and beginning quants.
- WealthLab.
A great tool for novice also traders. It can be used as a trading platform, strategy back tester, and platform for creating trading algorithms for financial markets. You can write your trading ideas on the popular C# language. Plus, you can use the Wealth Script library which makes describing standard functions a piece of cake. The software allows you to use different sources of quotes and upload quotes from text files. Official website: http://www.wealth-lab.com/

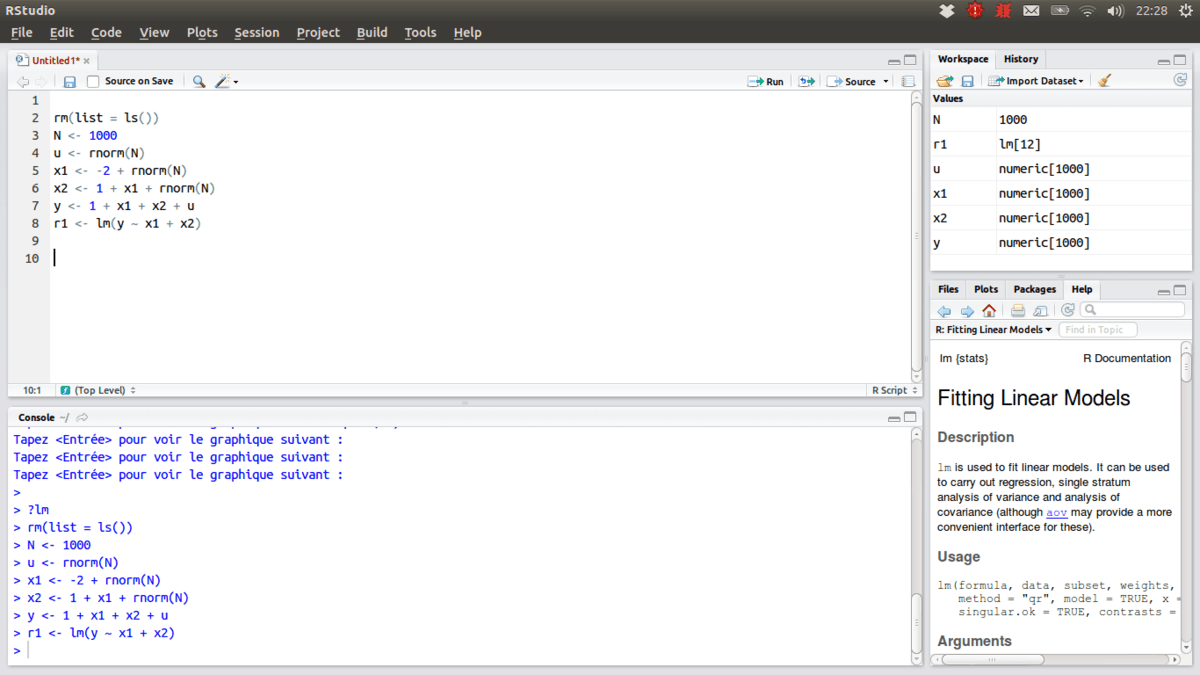
- R Studio is a solution for the quants rather than novice algorithmic traders. The software uses several programming languages, including R. R is a programming language designed for data and time series. You can create, test and optimize mathematical models and interfaces, assess statistical characteristics of time series, and many more. R is a flexible and versatile language. Plus, it’s available absolutely for free. With it, sophisticated mathematical and econometric models can be described with several strings of code. This is possible thanks to a huge library base with a variety of econometric tests, models, and more. Official website for R: http://www.r-project.org/. Official website for R Studio: http://www.rstudio.com/
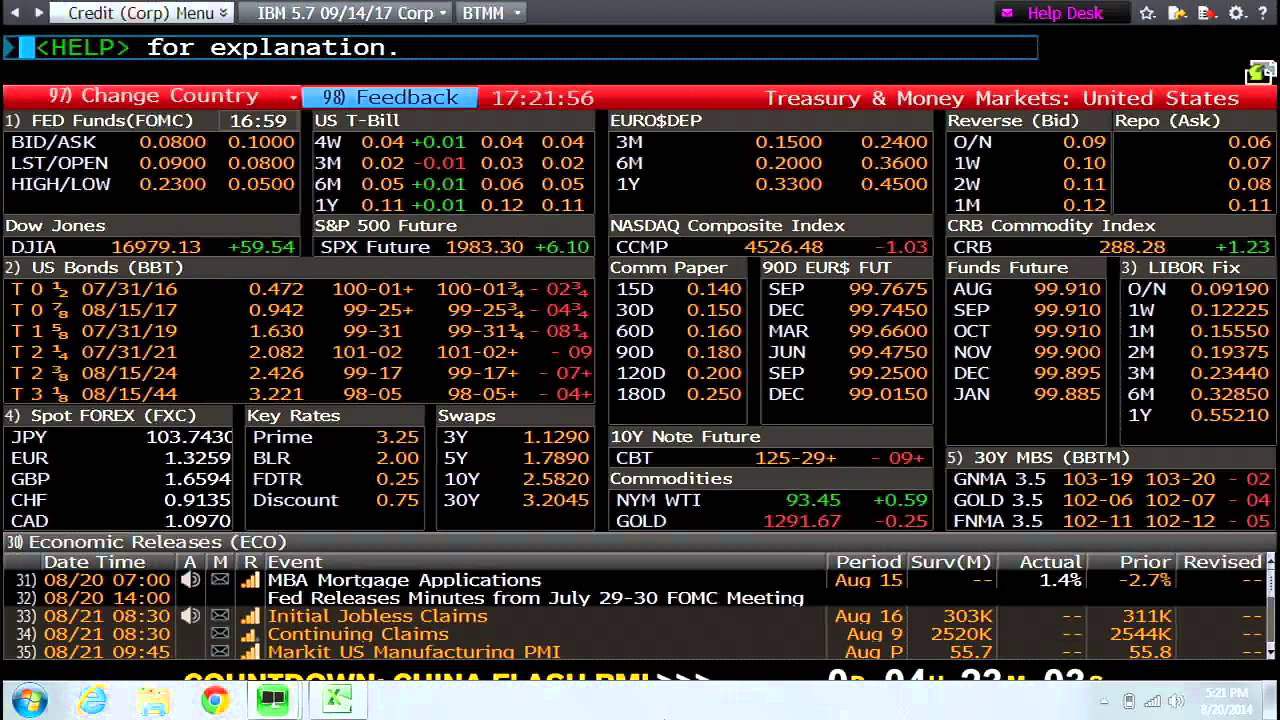
- Bloomberg is one of the top data and analytics platforms out there. It offers loads of information from the world of finance and related industries. Historical prices, data sets on industries and companies, rankings, economic factors… Bloomberg is hands down, No.1 web resource for professional quants and hedge funds.
Wrapping it up
It’s safe to say that econometrics and algorithmic trading are extremely interesting disciplines that are worth exploring. At the same time, they are characterized by fierce competition. If you design and introduce a new algorithm or model, you’ll become the worst enemy of large funds and banks. Needless to say, they’ll do everything in their power to remove you from the playing field.


