

Today I will try to explain several interesting features about the volatility of the Forex market. The key idea is not just to understand the meaning of the term, but to find a way to improve your trading with the help of this knowledge.
Before reading the article and writing your questions in the comments section, I recommend to watch this video. It’s not long but covers the biggest part of questions on the topic.
Good to know: i don’t use volatility measurement in my trading approach, but the understanding of the term is important for each trader, especially if you trade intraday, so i recommend to read the article till the end.
Volatility is the range of the price change from it’s minimum to maximum during the trading day, week or a month. As higher the volatility is, as bigger the range of a certain time frame.
Does it sound difficult? It’s very simple.

Look at two daily candles that I marked. If we calculate the range between the low and high of each candle, we will find out that the first one has more than twice the higher range than the second one.
That means that the daily volatility of a white candle was twice higher than the daily volatility of the black candle.
Simple, right?
You can check the high, low, open and close price of any candle (or bar) by moving the cursor over it. The info will be in the bottom right corner of the trading platform.

You can measure volatility during the week, day, trading session, an hour or 5 min. Traders measure volatility over the last N candles (bars). For example, you can measure the average daily volatility over the last week. To do this you should sum up daily ranges of the last 5 daily candles and divide it by the number of candles.
Table of Contents
Why does the volatility vary so much?
Why one candle can be bigger or smaller than the other one? It might be dozens of reasons for that. I will list just a few of them
Trading sessions and daytime
The market is always more active in the opening of a trading session.
- Fundamental events in the economy of a particular country
News, events, speeches and other performances that have importance for the market increase the number of trading orders which naturally increases the volatility.
- Other reasons of increased number of orders in the market
As I understand it, the main reason for the increased volatility is the same – a big player does something in the market. When the big money comes, it instantly affects the price. Of course, in these moments traders see breakdowns of important price levels, but this is just the consequence. When the big player comes, the game starts.
How to Use Data on Volatility on Practice?
From my point of view volatility, data might be used for intraday traders to understand the potential of their upcoming trading positions. With the help of volatility factor we try to predict the potential of this or that trading position.
Example
Let’s take a Eur/Usd pair as an example. We checked the volatility chart (you will see it below in this article) and know that the average daily volatility this week is 90 pips (this is an example, not the real data). Today the price has already made 65 pips up and we are thinking of opening a long position. We are intraday traders and at the end of the day we close all our positions no matter what. Question – will this information stop us from entering along? I would say yes, I should.
Maybe the example is not that representative, but the idea of how to use volatility is shown correctly. We used statistics to determine the potential of the current movement. If the range that the price has already made today is close to the average daily volatility, statistically we shouldn’t open a position in that direction. Meanwhile, we can start searching for an entry point in the opposite direction (in our case it’s short).
Warning! All entry points should have additional analytical basis like price action pattern, trend indicator signal etc.
Besides, a lot of MT4 indicators and oscillators are using the data on volatility in their calculations. I will talk about it a bit later, and now let’s see, where to find them ready volatility measurements.
How to measure volatility?
Of course, you can always measure the volatility manually, subtracting Low prices from High prices and dividing by the number of candles. It’s not taking that long, but of course, it’s boring and taking energy that you can devote to something more useful.
((High price 1 – Low Price 1) + (High price 2 – Low Price 2) + (High price 3 – Low Price 3) + (High price 4 – Low Price 4) + (High price 5 – Low Price 5)) / 5
Don’t worry, everything is already calculated for you:
This is a widget from myfxbook, so the data is accurate and timely. Here we have measurement for all trading instruments and all timeframes that we have in the Metatrader platform.
On the site you can filter trading instruments by the average volatility index and choose from instruments from the list.

Indicators that use volatility for calculations
You don’t even need to use extra services since everything is already built-in in your trading platform. This is a short review of most popular volatility-based indicators, on pipbear.com you can find a detailed review on each of them.
Average True Range (ATR)
ATR is the most popular volatility-based indicator. Which is mostly used to determine the right Stop Loss and Take Profit orders.

As higher the volatility is, as higher you can put the TP order and as higher the risk of accident SL touch is. Of course, this is just the theory, you need to put the indicator to the chart and test it on your own!
I don’t use any indicators in my trading, either to determine the price direction or the range of SL/TP orders.
Since this is my blog, I can say that even when I observe indicators 🙂
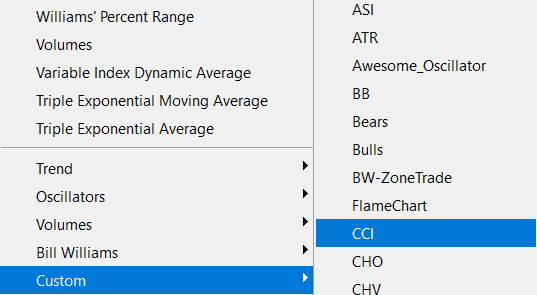
Commodity Channel Index (CCI)
CCI can be found in the Custom tab.
Commodity Channel Index indicator combines the average price data and the moving average. As far as I know, often it’s being used as an oscillator, which means that when the price is in the overbought zone, you are seeking for an entry point to Sell. When the price is in the oversold zone, you are seeking the entry point to Buy.
Bollinger Bands
The third good example is using the volatility data to determine the range of a price corridor is Bollinger Bands.

When the bands come close together, constricting the moving average, it is called a squeeze. A squeeze signals a period of low volatility and is considered by traders to be a potential sign of future increased volatility and possible trading opportunities.
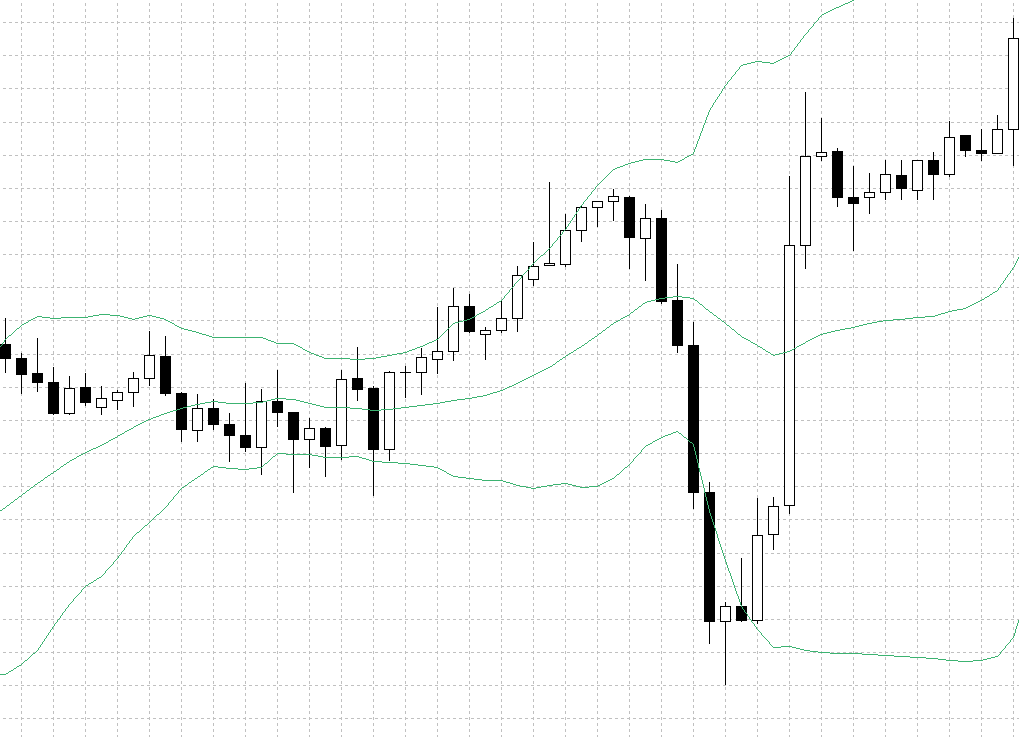
Conversely, the wider apart the bands move, the more likely the chance of a decrease in volatility and the greater the possibility of exiting a trade. However, these conditions are not trading signals. The bands give no indication when the change may take place or which direction price could move.


As a scalper I have added much of what I really lacked since I chose scalping as my trading strategy.
This will really help in improving my trading career.
I am from Lagos I love NFP day…when I make kills….
Spreads are high when volatility is high
Breakouts are pretty very profitable
can a broker influence volatility?
That was so helpful…quite a piece
best trade strategy works with volatile markets and not calm markets