Range bars were introduced in the middle of the 90s by Vicente Nicolellis, a Brazilian broker and trader who spent a decade managing a trading desk in San Paulo.
Nowadays, range bars are gaining popularity among Forex traders. Range bars are a great tool to interpret and assess market volatility and make profitable entries. What’s the secret of range bars? How can you use these setups for profitable trading? In this article, we’re going to discuss these and other issues.
Before reading the article and writing your questions in the comments section, I recommend to watch this video. It’s not long but covers the biggest part of questions on the topic.
Table of Contents
What is a range bar and how can it be useful for Forex traders?
As mentioned earlier, range bars were discovered by a Brazilian trader Vicente Nicolellis. Back in the 90s, markets were characterized by high volatility. Nicolellis wanted to design a trading tool that could allow traders to capitalize on market volatility. He found out that price movement was the main factor in interpreting market inconsistency.
As a result, Nicolellis introduced the so-called “range bars” to analyze price changes. Out of all variable parameters, range bars only consider price. In other words, range bars don’t take time into account. Since range bars are not determined by time, they can take any amount of time to unfold, whether it’s 10 seconds or 1 hour. For a trader, this means that you don’t need to monitor Forex charts for hours on end.
A range bar must have the specified high-low range. Each new range bar opens outside the high/low of the previous bar.
About range bars
A range bar is a variation of a tick chart where new bars are determined by previous price fluctuations.
A trader needs to set the difference between the high and low of a range bar (high-low range). A range bar will be forming until its high-low range reaches the value set by a trader. Once it happens, a new range bar will start unfolding.
As mentioned earlier, the formations are not limited by time. Different range bars can take different amounts of time to form.
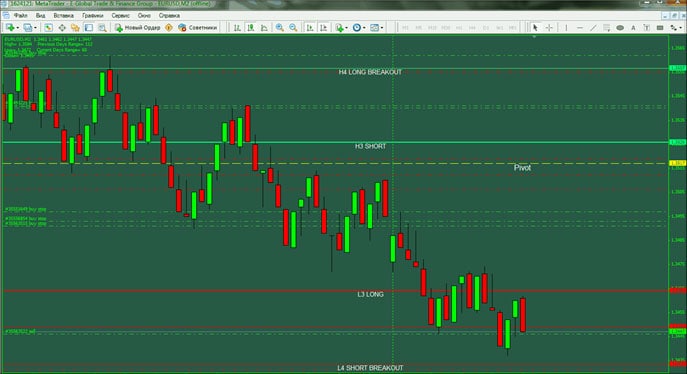
Some Forex trading platforms have range bars included in their standard toolbox. Unfortunately, such platforms are mostly fee-based. For this article, we’ll be using the free MT4 platform to learn how to apply the range bars strategy:

Each range bar presents a vertical price range. A new range bar won’t be formed until the previous bar closes. Using range bars, you can filter out market noise during consolidation periods and identify Forex patterns with a high degree of accuracy. (In time-factored charts, this wouldn’t be possible.)
The peculiar thing about range bars is that the closing price of the previous bar equals the opening price of the next bar. The exceptions include some market periods, such as closing/opening of a trading session, major news releases, and the like.
How to trade range bars: F4 pattern strategy
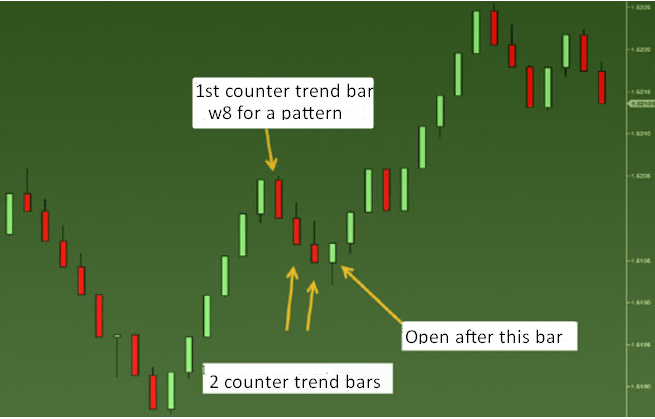
F4 pattern strategy is designed for long-term trading in a trending Forex market. Once you’ve recognized a strong trend, you need to identify an F4 pattern. What does it look like? F4 pattern opens with a reversal range bar that formed against the trend. The pattern includes 3 countertrend bars and closes with a reversal range bar that formed with the trend.
It’s a great strategy with high-probability entry signals that allows you to capitalize on strong price moves. The F4 pattern strategy requires placing multiple orders. You need to add a new order when a price pulls back and forms another F4 pattern or breaks out of a support/resistance level.
In the chart below, you can see a standard pullback consisting of 4 bars. Keep in mind that a trend must be confirmed on a high timeframe. You need to enter the market when a price pulls back, forming 4 range bars. The 3rd bar, which precedes a reversal bar within a trend, must have a long wick.

It’s not uncommon that an F4 setup includes two consecutive pullbacks, with each pullback forming 3 range bars. You can examine this modification in the chart below.

The F4 Pattern strategy doesn’t use indicators. Still, you can apply the ATR indicator for placing a stop-loss order. Please note that this strategy works best during the peak periods at New York and London trading sessions.
How to trade range bars using indicators
Let’s discuss another range bar Forex strategy that leverages the power of indicators.
Here are the indicators we’ll be using:
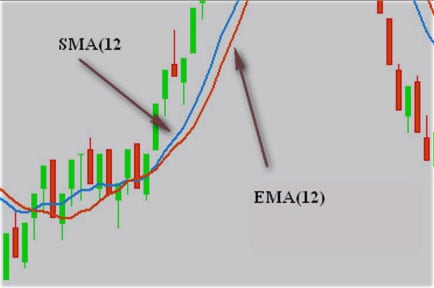
- 12-period ЕМА;
- 12-period SМА;
- 2line_MACD (one of the MACD variations) with the following parameters: Slow МА period – 16, Fast МА period – 8, and Signal МА period – 5.
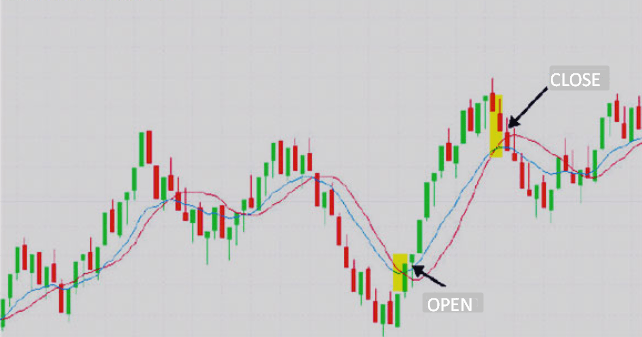
Choose a trading instrument and add the indicators on a chart. As a result, your chart will look something like this:

Entry conditions:
- 2line_MACD lines cross above or below overbought/oversold zones;
- ЕМА crosses SMA;
- Range bar closes below or above the crossing point.
Once these conditions have been met, wait for the next range bar to make an entry.

The EUR/USD chart above is trending upwards. We need to identify a long entry point. The MACD lines cross below the oversold zone at -0,0001045. ЕМА crosses SMA downwards. The range bar closes above the crossing point. As you can see, all entry conditions have been met and we can enter the market.
To exit the market, you can choose from a variety of methods, including psychological levels, Fibonacci levels, support/resistance levels, and the like.
Be sure to first test the range bars strategy on a demo account. Once you feel that you’ve gained enough experience, you can switch to real-money trading. This golden rule holds for any strategy or technique. Good luck!


