

After a long talk about fundamental analysis, we can finally start discussing the theme, which is the reason for many traders to go through my course. Price Action is not a specific strategy or a price behavior pattern. We are going to talk about the method of market analysis having the chart as the main tool. We will not use statistical indicators that calculate the patterns, but we will perform only using the candlestick chart.

Before we start talking about some specific patterns, I need to say a few words about how we are going to learn technical analysis. We will spend three lessons in a row to discuss Price Action. This article will be devoted to the main chart patterns and the methods of creating them. We will focus on the candlestick analysis in the next lesson, the key idea of which is how to combine the chart and candlestick models within a single strategy. After candlestick analysis, I would like to give a lesson on the methods that make it possible to determine the support and resistance levels, in which both the chart method and indicator method are combined. In short, the course came out interesting and I do wish you to go through it and not miss out on any key ideas.
Once again, I do not equate Price Action with Candlestick Trade, though many articles state that they are the same thing. My course will help you to take a close look at both methods.
Table of Contents
Key Idea of Price Action
The fundamental principles of Price Action are described in the book 1999 “Technical Analysis of Financial Markets” by John Murphy, which is considered the “Trader’s Bible”. This book contains information on the price patterns, technical analysis patterns and trade recommendations.
Despite the book was published more than 20 years ago, many of the ideas described by John Murphy are still up-to-date. Naturally, the market transforms, the trade approaches change and the old technologies are replaced with the new ones.
I do not want to rehearse the content of the book or just copy from the contributed works, so I am offering you my representation system of the Price Action models.
I think that the essence of Price Action is the search for the support and resistance levels on the chart.
The level is a point, not a line.
In other words, certain chart patterns can help a trader to see that the balance between supply and demand is changing at a particular point in the chart, resulting in the price trend switch.
The peculiarity of this method is that when we are looking at the chart configuration, we need to see beyond the interaction between the sellers and the buyers, their intentions, and their goals.
Let me give you a simple example. We open the daily chart, see that the asset price trend has switched at the level of 1.5000 several times, and never fell below this level.
We can assume the following:
- The big players are buying at this level.
- Monetary authorities and institutional investors deliberately keep up the price above the 1.5000 level.
- It is a coincidence and the price may easily go lower than the 1.5000 level next time.
If the first two conclusions are correct, we can look for an entry into a long position after a minimal bounce from the level.
Anyway, Price Action is based on the theory of marketing control (this is what I call it). The essence of the theory is that the market is under the control of the major players who buy and sell currency following the same rules. If you understand these rules and know when the major players open and close positions, you can join them by trading the same way they do.
Let’s talk a bit more about the patterns.
How to Read Forex Charts
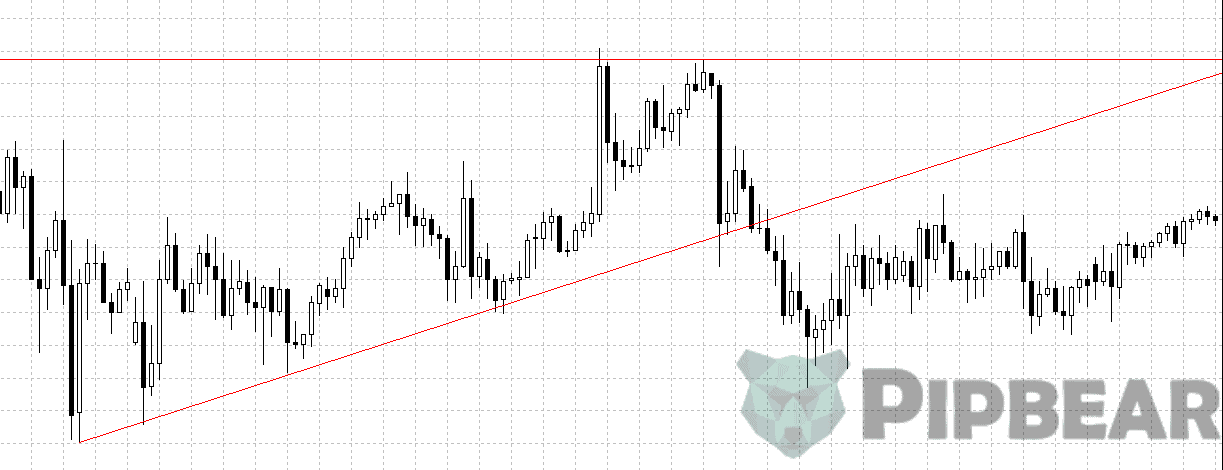
We should introduce the terms “pivot” and “extreme” to work with the chart.
These are the minimum and the maximum price values over a certain period but if we trade manually not trying to use the robot to automatize the strategy, it is easier to catch the sight of these points. Look at the example below.

I noted three high swing levels (pivots) and two low swing levels (pivots) on the chart. Therefore, we have five swing levels in total, when the price has switched its trend to the opposite one.
The Dow Theory describing stock price behavior is one of the best-known postulates of the financial market, created by the American journalist Charles Dow at the beginning of the 20th century.
According to the Dow Theory, each subsequent peak of the uptrend (or downtrend) should be higher (or lower) than the previous one.
You can see how this should look on the chart. Each subsequent peak of the uptrend is higher than the previous one.
You can see a downtrend with each pivot lower than the previous ones on the next chart.
Connecting the Pivots
If you see pivots on the chart, connect them. We use the tool “line” on the MT4 (MT5) platform to connect the pivots on the chart. If you have not yet installed the terminal, you can download the program from the website of any broker.

When you connect the pivots, you will get a figure that is called a chart pattern. The main task of a trader is to understand the price behavior within each of these patterns, and how to open and close positions to get a profit in most cases. Let’s take a look at each pattern and determine the best trading strategy in a market situation.
Price Channel
Price channel is the most popular chart model on the forex market. There are several approaches to form the channels and classify them. So I will pass right to the classification I use.
Ascending Channel
If you need to make the precise pattern on the rising chart, you should follow these steps:
-
- Identify the low swing levels (the pivots, at which the price movement switched from the downtrend to the uptrend).
- Connect the low pivots using the line
- Put this line also to the high pivot. Copy this line and drag it to the high pivot.
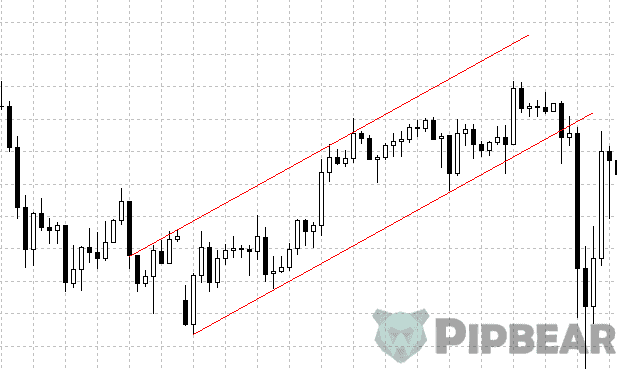
The most common trading strategy is to look for the opening point at the low of the channel and close the position at the high.
Descending Channel
-
- Identify the high swing levels (the pivots, at which the price movement switched from the uptrend to the downtrend)
- Connect the high pivots using the line
- Copy and drag this line to the low pivot.

The strategy is very much the same as the previous one. You should look for the opening point at the high of the channel and close the position at the low.
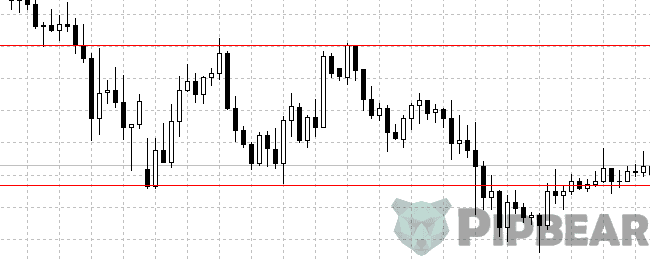
Horizontal (flat) Channel
The horizontal channel is the most contradictory option and has the following peculiarities:
- The channel’s limits are set by the extremums on both sides.
- It is typical of the horizontal channel to contain many false breakouts.
- The price changes its value more often within the channel not reaching its limits.
My Best Practices in the Price Channel Trade
I have figured out the following rules of the channel trade:
- Channel up and channel down trade is more effective than the horizontal channel trade.
- False breakouts are the best signal to open a position.
I will tell you more about the false breakouts in the lesson devoted to the support and resistance levels. Some traders believe that the major players initiate the false price movements to disrupt the stop-loss operations of the smaller players and get a position to sell or buy at their expense. That does make sense and I prefer to explain the false breakouts this way. Nobody knows how it truly works but it doesn’t matter.
The key goal of a trader is to understand what to do in case of a certain pattern.
Generally, the traders use the following signals to open the positions:
- Touch and bounce from the level.
- False breakout of the channel’s limit (breakout and closing lower than the resistance level or higher than the support level)
- Reversal candlestick model near the channel limit.
We shall talk about the candlestick patterns in the next lesson. The peculiarity of such openings is that a trader doesn’t wait till the price touch the border of the channel but opens a position in advance when he sees the first signs of a turn.
You should close the position before it reaches the channel opposite limit.
You should decide whether to follow or not to follow this advice only after you conduct your tests. When you begin testing the strategy, create the price channels and calculate the potential financial result, and analyze which approach would work better:
- Take Profit Order set at the opposite limit of the channel.
- Stop-loss Order set at the 20-40% point from the channel limit.
Different trade tools may work variously in the different timeframes so you will need to test them.
- Closing the position by the indicator, oscillator, candlestick model or any other signal.
In other words, you should add another point to the trading strategy to get a more accurate closing.
- You should use both bounce and break out of the channel level in your trade.
In case of a breakout, you need to keep in mind that the breakout of the high level (the resistance level) of the channel in a downtrend will mean a trend switch, which correspondingly has greater potential in terms of the price movement size.

Breakout of the channel low level (support level) in a downtrend will mean a trend strengthening. However, in my practice, such breakouts are most often false ones and after a little movement, the price returns to the channel. The situation is completely the same in case of an uptrend.
I made the following conclusion out of it. In case of a downtrend you should better trade a breakout of the resistance level, and in case of an uptrend, you should trade a breakout of the support level. I do advice you not to take it on trust, but to put this theory to the test.
- After new pivots arrive, you should redraw the price channel.
In case of the breakout and the price-fixing beyond the price channel, you will need to redraw it. Redrawing the lines by hand is more effective than using the indicators that are redrawn automatically after the event. Think it over!
The most important conclusion of this lesson that I would like you to understand is:
The longer timeframes are, the less reliable are the chart analysis figures. If you are testing the same pattern in the D1 and M15, the result may vary by time.
Check the same strategy on different timeframes and draw your conclusions!
The Triangle pattern
In the case of the channels, we usually connect the pivots and form the level of support or resistance and then copy out the line to the opposite channel limit.
There are three types of triangles:
- An ascending triangle. It has a horizontal level at the high with the pivots at the low connected by the bullish line.
- A descending triangle. It has a horizontal level at the low with the pivots at the high connected by the bearish line.

- Asymmetric triangle. It is formed by two concurrent lines.

Theoretically, the asymmetric triangle should mean that both lines are set at the same angle to the horizontal line.
Naturally, it doesn’t work in the real market conditions.
I am also quite skeptical about classifying the triangles into the ascending, descending and symmetric ones. I can tell you from my experience that I use the so-called symmetric triangle in 90% of the trading cases.
Traders just connect the extremes, which are on the same line and form a figure.
Dividing the triangles into ascending and descending may be useful only because a trader observes breakouts only of the horizontal level within these figures. This would mean that:
- We open a long position in the ascending triangle (breakout of the resistance level);
- We open a short position in the descending triangle (breakout of the support level);
I should remind you once again. Test everything you learn! However, I must admit that:
- Many traders open both long and short positions in any triangle, regardless of the formation.
- The classic triangles with a horizontal level hardly ever exist.
- Logic of the chart figures makes fundamental sense, which is why the traders like to trade this formation.
Converging support and resistance levels, which form a triangle (or a pennant) that represent the price consolidation within the range. It is generally accepted that the major players are gaining positions within this range. If we describe this process metaphorically, we can imagine the struggle of a bull and a bear. Only one can win and get a breakout of the level in our case.
Why Does Studying Other Price Action Patterns Not Make Sense?
Even though my lessons are quite voluminous, I am trying to avoid providing my readers with useless information. I believe if you understand the basic principle of the inclined levels, you do not need to waste your time searching the popular chart patterns, such as:
The reason is that each of these figures has a simple fundamental thing, which is the inclined level that we trade. From my point of view, most traders consider the most reliable pattern the double, triple, etc. bottom or top. While using the double/triple top pattern, one can draw an important conclusion applicable to all figures in chart analysis. Let me tell you about it in detail.
Double Bottom Pattern and Important Conclusion
We have already spoken on the very simple basic principle laying based on this pattern.
If the price has come twice to a certain level and bounced, we can consider this level strong.
The support level is called the double bottom (when the price is lower than the current price).

The resistance level is called the double top (when the price is higher than the current price).

I must admit that it is about the horizontal level in the classic version. That is, even if a top is slightly higher or lower than the second one, a trader still goes through the horizontal level. Nevertheless, I mention this pattern for another reason.
The more pivots this level creates, the stronger this level is.
It is the key conclusion applying to all chart models and the process of creating the support and resistance levels in general.
That is why the triple top pattern is more reliable than the double top pattern. The triangle formed over a month makes a stronger movement than the one-day triangle.
In the context of the trade, you may explain the strong level in two ways:
- Bounce from such a level has a better statistical chance than breakout.
- In case of a breakout, a strong recoilless movement is more likely to happen than a false breakout or return to the trading range.
These statements cannot be considered a heal-all, especially if we are talking only about probabilities. A trader should work out such an approach that will allow him to make a profit out of each scenario of the support and resistance levels adjustments. We will discuss these scenarios in the following lesson.
1-2-3 Pattern and Recoilless Movements
As I have said, you will not have to search for a separate pattern after you understand the key principles of the level formation. The “1-2-3” pattern represents the classic definition of the trend and describes the usual market movement within a directional trend.

I must say that this figure is a reversal model and you can see it most often at the main trend switch or the end of the correction of the main trend.
The “1-2-3” pattern and other classic models have one important advantage I have not mentioned before:
Every model has a price target, which is the point for a trader to set the Take Profit order.
For instance, the “1-2-3” pattern involves the following price movements (we take a bottom-up model with reverse down as an example):
- Top formation (point#1);
- Correction and reverse up (point #2);
- Movement toward the top and reverse down (point 3). Point #3 is between the point #1 and #2.
- Movement toward the point #2 and break out of the level.
The trading position parameters look like this:
- The pending order is set on the breakout of the level of the point #2.
- Stop-loss order after the level of the point #3.
- Take profit order set between the point #2 and the point #3.
It would be great if you find the time to test this model in the strategy tester mode. After you analyze the real market, you will see that in most cases the price goes beyond the set minimum goal. If that is true, you can figure out how to set the take profit order while working out the “1-2-3” pattern to improve your financial performance.
Indicators Used for Search of Chart Patterns
I never use the indicators to search the figures on the chart. As you may have noticed, I create the support and resistance levels instead of searching some particular chart patterns such as Diamond or Head & Shoulders patterns.
Nevertheless, there are the traders who adore automation, indicators and Expert Advisors. I should explain to them, that some indicators are drawing the chart patterns by certain price formations.
I have found a few following indicators:
- Pattern Graphix
- Price Patterns
- PZ Harmonic Trading
I am not going to pay a lot of attention to the indicators in this lesson. I will devote an entire article for each of them and you will always be able to read it on my website. Each indicator shall be described with its advantages and disadvantages in a separate article.
Conducting Tests in Chart Analysis
We have already discussed the strategy testing in a previous lesson. If you have not read it, I do advise you to go click the link and have a look at it.
When I test the trading approaches including the chart ones, I do not use anything else but a chart and the strategy tester. I do not use any trade history later than 6 months in the strategy tester. If you are not familiar with the strategy tester, I recommend you to read the article I have mentioned in the previous paragraph.
Summing Up
Many years ago, I picked the chart analysis as the main trading tool for all the markets I trade-in including but not limited to the forex market, the stock market and the futures market. Here are the key reasons for my choice:
- You do not need to spend time processing a huge amount of information such as the news or the analytical reports.
- You may see the real interaction between the sellers and the buyers behind the bars and candlesticks. All the market players see the same chart.
- The main ideas of chart analysis are common for any financial market including the cryptomarket.
I would like to finish the lesson on chart analysis at this point. I have deliberately not mentioned some popular trading approaches such as the Fibonacci and Gann tools in this article. You can find a lot of information about these tools on my website written by other traders. Let’s go straight to the main conclusions about the forex chart analysis, which I would like to reiterate to my readers.
Key Ideas of the Lesson
- The level is not a point but a line.
- The traditional definitions of the terms “trend” and “level” given more than a hundred years ago are still up-to-date.
- False breakout is the best pattern to open a trading position.
- You can distill all the popular chart figures down to a few simple regularities.
- The more pivots the level has, the stronger it is.
- Even if you have read a huge amount of literature devoted to the patterns, you need to test them all on the real live charts.
I would love to see your thoughts on the lesson in the comments and I’ll be happy to meet you in the following lessons, at which we will keep talking about Price Action and discuss the Candlestick models.
Sincerely,
Pipbear


This is so well explained….. Thanks for the hard work
I prefer trading with a clean chart, no indicators, just myself and the candlestics
Am just curious, what are the background forces that lead to these patterns. Am sure there is more to it not just some patterns
Thanks for your time and efforts on this one. Even though I knew these concepts, but I learned some new things, which will help me in honing my skills
This is another lesson that will help me to become a consistenly profitable trader!
Very powerful combination of impulsive trend and pin bar. However we have to be more patient to wait the trend was formed.
i just wanted to say that your Price Action & pin bar concepts make real sense & im more interested in the price action & pin bars study in the above mentioned article.
Nice and well explained article. Keep up the good work. Cheers!
Great stuffs altogether. Thanks