

Average True Range (ATR) is a technical indicator of market volatility. It was developed by Welles Wilder in the book “New Concepts in Technical Trading Systems” and since then is used as an element of many other indicators and trading systems. This is a fairly popular indicator included in most programs for market analysis. Its main purpose is to set the correct Stop Loss levels. According to the statistics, this is the most efficient way of setting the Stop Loss orders.
Before reading the article and writing your questions in the comments section, I recommend to watch this video. It’s not long but covers the biggest part of questions on the topic.
The traders use the ATR also as a trend filter. You can interpret it the way you do with other volatility indicators. The principle of forecasting using the ATR is as follows: the higher the indicator value, the higher the probability of a trend change. The lower its value, the weaker the trend. We will discuss the indicator in detail in this article.
Table of Contents
INDICATOR CHARACTERISTICS
Platform: Any
Currency pairs: Any
Timeframe: Н1 and higher
Trading time: 24-hour
Indicator type: Oscillator
CALCULATIONS
The True Range is the largest value of the following ones:
- difference between the current maximum and minimum.
- difference between the previous closing price and the current maximum.
- difference between the previous closing price and the current minimum.
True Range = Max(High[1]-Low[1]; High[1] — Close[2]; Close[2]-Low[1])
The Average True Range indicator is the moving average of the True Range values:
Average True Range = SMA(TR, N), at which TR – true range, N – averaging period, SMA – simple moving average.
You can only set the average period (14 by default) in the ATR settings.
USING ATR AS THE FILTER
You can use the ATR as a trend filter as well. To do so, put the median line on the ATR chart. When it is broken out, you can see the most significant price movements. The indicator does not (and can not) have some negative values and the specified median line as well. You pick it by the eye separately for each market. We advise you to use the MA with a large period as the median line to put it on the chart.
Meanwhile the ATR is below its Moving Average, the moves are quite insignificant and the market is flat. If the ATR is broken out bottom-up by its MA, you can be sure that the trend begins. Moreover, some traders recommend using the indicator on several timeframes, for example, H1 and D1. If their directions are coordinated and the indicator crossed its median line on a smaller TF, the market is rallying. Once again, configure the ATR and the median line separately for each market and each timeframe.
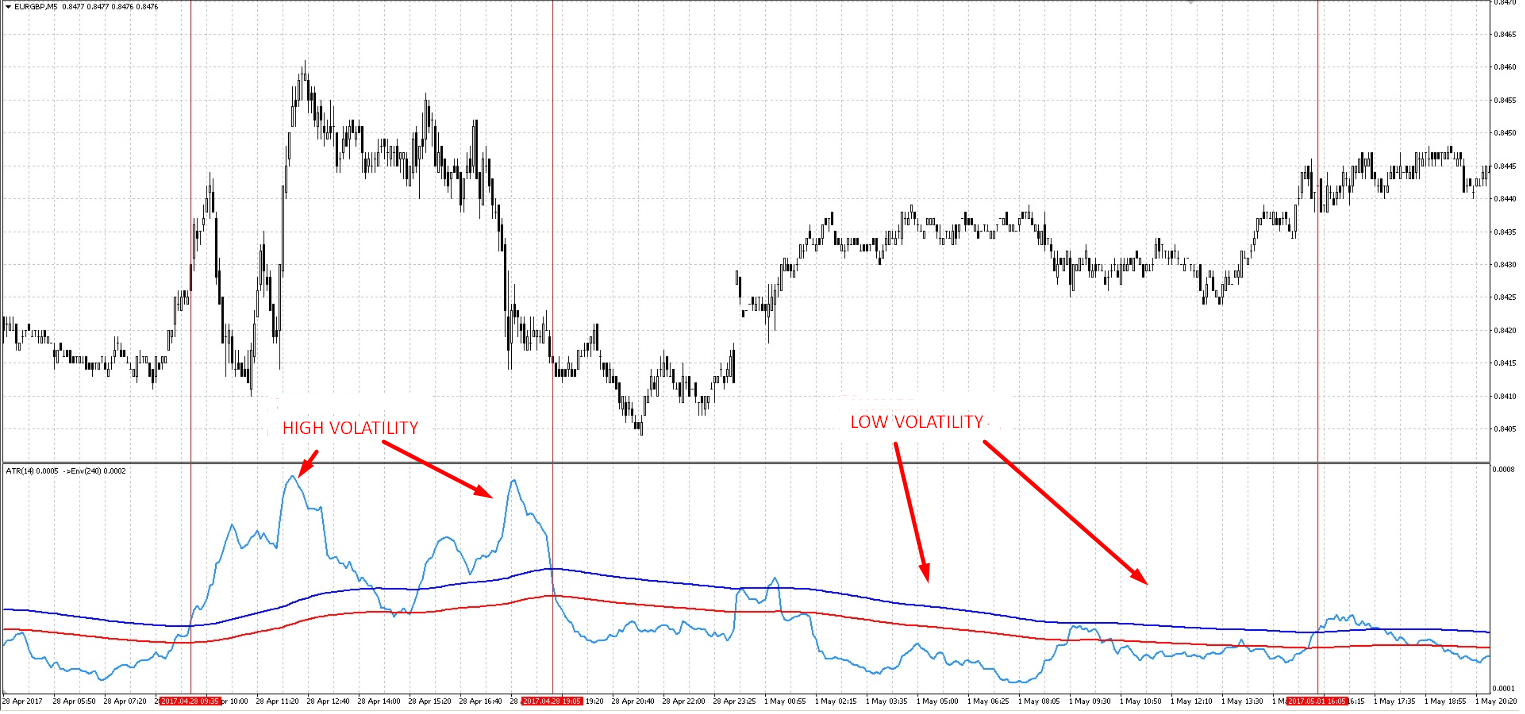
ATR14 and MA100 work fine as the median line for determining the trading time in the trading systems based on the principle of return to average. The Envelopes indicator (240) also works well while applied to the ATR indicator value. The volatility is low when the ATR is below the Envelopes and after the channel is broken bottom-up, you may see some sudden volatile movements. ATR is often used to determine the average length of a candlestick. For example, if the current ATR value is larger than 20 (let’s say so) or less than 10, you should not enter the market. It is quite logical since if the current market contains two small candles, you won’t get a profit.
If the candles are too large, some extreme actions are most likely to happen on the market such as the release of important economic news. As we all know, the market is quite unstable during the news release and it is quite difficult to predict the further direction of the tool movement.
HOW TO USE ATR TO CLOSE TRADE
The traders often use the ATR for setting the adaptive Stop Loss orders both locked and floating (Trailing Stop order). As for me, I like the idea of setting the Stop Loss orders on volatility and I often use it for Trailing. To calculate the required size of the Stop Loss order, you need to multiply the indicator’s value by a certain constant, which depends on the theoretical duration of the future transaction. If you deal with the hour charts, for example, you can take a constant of 2 to 4. That is, for the EURUSD transaction and ATR = 0.0062, we should multiply 6.2 by a constant, for example, 3 and our Stop Loss order will be about from 18 to 19 points.

It is more convenient (and I consider this correct and logical) to use ATR for the Trailing Stop orders. In this case, the trailing value will automatically adjust to the current market volatility. For example, imagine that we have entered into the transaction and made some certain profit on the position, and the Trailing Stop order has begun to pull up to the price at the given distance. The price started a sharp movement in the right direction. The Trailing order is at quite a long distance allowing the market to move on.
After that, the movement ends and the flat begins. Accordingly, the ATR falls and our Trailing order becomes shorter since the Stop Loss order is shifted closer to the price. As you know, the flat comes to the market after the periods of a strong trend. After that, the price again starts moving sharply (maybe in the wrong direction). If the price reverses right after the flat period, we won’t lose much money since our Stop Loss order is close enough to the price. If it keeps going this way, then things will go the same way again until the Stop Loss order is finally activated.
CONCLUSION
It’s hard to imagine any significant advisor not using the ATR indicator. The traders often use this indicator while creating the automatic trading systems especially when it is necessary to create volatility filters or adapt different values to the market. Also, the ATR indicator is indispensable in any measurements made in points. Instead of rigidly setting, for example, the candle height of some candlestick pattern, it is much more convenient to specify these values as an ATR value multiplied by a certain coefficient and thus adjust your trading model flexibly to the current market volatility. Despite the ATR indicator is used throughout in algorithm trading, the manual-working traders often underestimate the capabilities and utility of this indicator. I do hope that many traders will take a closer look at the ATR indicator after reading this article.


Thanks a lot Sir. What indicators do you usually use along with ATRs to see trend in a day trade.
This is an awesome presentation, I do enjoy your style. Keep up the good work.
This is the best ATR ar icle i have read on line, you are a great instructor, am looking forward for more of your piece here
Wonderful and detailed explanation. This is really appreciated.
Wonderful once again! Please I’d like to have this indicator as well as the pdf on how it works. Is there a specific time frame or timeframes it works with best?
Awesome presentation! You really clarified the concept of the ATR, thus make easier to apply
I find your articles not only inspiring but very easy to read, do you offer daily market analysis?
Coach, you are doing great online ….. please prepare some videos to go along with the articles