

The Channels are one of the very first tools of the market analysis, which is why the channel-based trading strategies are so popular in different markets. The channel-based strategies differ from each other only by the channel creation techniques. The Donchian Channel strategy is one of the most interesting and simple channel strategies.
Before reading the article and writing your questions in the comments section, I recommend to watch this video. It’s not long but covers the biggest part of questions on the topic.
Richard Donchian is a legendary trader who achieved success oldest-old and kept working to a ripe old age. Donchian was a pioneer. He launched the first futures fund Futures Inc. in 1949 that served as the prototype for the mutual funds in the USA. Also, the well-known Turtle trading system was made basing on his work. He developed the so-called moving channel that was later re-named after his name (the Donchian channel) in the early 1970th.
In fact, the Donchian channels are the volatility indicator based on calculating the current price range by applying the recent lowest and highest prices.
The Donchian channel is displayed as two lines on the charts, within which the price impacts occur. If the price goes beyond the channel, then you get a firm signal to open a transaction. This structure of the Donchian channel makes it similar to other volatility indicators, for example, the Bollinger Bands indicator. The differential feature of the Donchian channel is that it uses only simple calculations of the last minimum and maximum while drawing the lines. Thus, it is only required to find the lowest and the largest prices over a certain period to create the Donchian channel.
Richard Donchian advised using a period of 20 for creating the channel since it is the average number of working days per month. This means that the indicator analyzes the values of the last 20 bars at each bar and calculate the minimum and maximum values displayed in the form of the lower and upper bounds.
A period of 20 can be convenient for creating the Donchian channel in the smaller timeframes too. Also, you definitely may use the periods of 18, 24, etc. to create the channel. For example, the period of 55 happened to be good to use in the case of the Turtle trading system. To calculate the required periods, you need to conduct the back-testing of this system. At the same time, the optimization criterion is the minimum drawdown of the assets on the account.
How to use the Donchian Channel
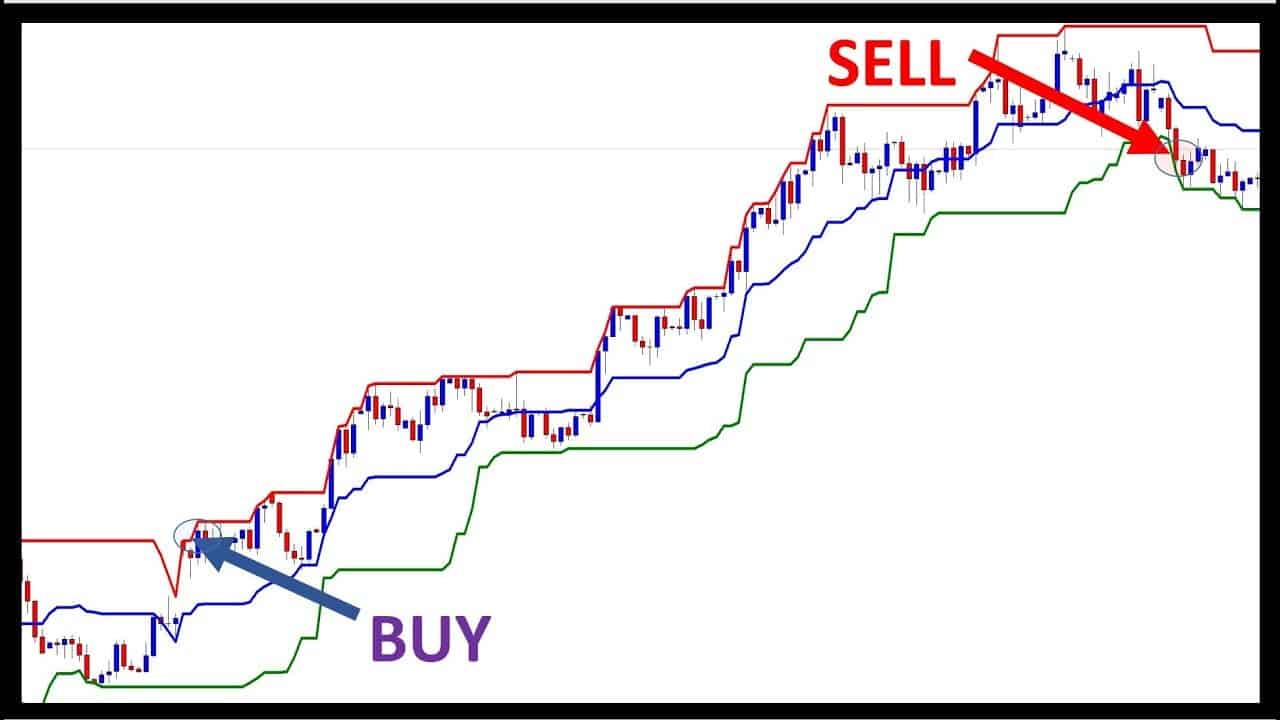
Despite the Donchian channels is a simple indicator, it can be very useful in some cases. First, the Donchian channel is a simple trend breakout system. The signals generated by the system are based on the following rules:
- If the price has closed above the channel, you should open the long positions and close the selling ones;
- If the price has closed below the channel, you should open the short positions and close the long ones.
Linda Raschke describes the strategy in this way. “If the price has reached 20-day maxima, you should buy. If it has reached a 20-day minimum, then you should sell. If you trade in several markets, you may use this strategy for a long period since something unusual may happen in any of them such as, for instance, the Persian Gulf situation, which will affect the cost of oil. Maybe sudden freezing will destroy a part of the coffee harvest. The system depends on the capability to catch an important trend or an extraordinary event. However, the strategy is characterized by extremely large falls and pretty bad success to failure ratio due to a large number of false breakouts”.
It true that a large number of poor entries are a typical feature of the breakout systems. However, in case of a strong trend, a single successful transaction will cover losses from all of the poor entries. Experience has proved that the average rate of profitable transactions is only from 20% to 30% of all the transactions in case of using the breakout systems. The Donchian channel is a classic example of a trading strategy when a trader should always be in the market and look for various ways out.
Nevertheless, if you have prudent portfolio diversification, good risk management and a certain amount of money (enough to withstand large drawdowns), then this strategy may become successful for you. It was proved by R. Donchian himself, by the “turtle traders” and a huge number of the traders using similar systems.
In addition to the described shortcomings, the exit point is another disadvantage of this strategy. The classic Donchian channel strategy requires the constant presence of a trader in the market. A long position shall be closed only when there is a signal to open short positions.
In this case, the traders often enter too late and lose a significant part of the profit. The “Turtle” traders modified this strategy. They advise to enter to the market on the long-period channel and exit at the signal of the short period channel.
As you know, the Donchian channels are the market volatility indicator. Consequently, if the price movements are quite small and calm, the channel will be relatively narrow. However, if the price fluctuates intensively, then the channel will be quite wide. It means that the width of the Donchian channel displayed as a separate chart and expressed in absolute values or points can be an independent volatility indicator. Such an indicator represents an alternative to the Average True Range (ATR) indicator and the Standard Deviation indicator. The prices often shrink into a rather narrow range before the intensive price movement begins. Therefore, when the Donchian channel sharply shrinks, it is a worthy signal to expect a large trend beginning.
On the figure, you can see the Donchian channel with a line drawn through its middle point. This line is called the Tenkan-sen line, which is an analog to the Moving Average line and serves as a resistance/support line. If the market is relatively calm, and the middle line of the channel is horizontal and a reversal candlestick pattern occurs on it, then you can expect the price movement to the nearest border of the channel.
The reversal strategies
So if a candlestick closes above the top line of the Donchian channel, then you see a signal to open a long position. If a candlestick closes below the upper line of the channel, you should open a short position. Sometimes you may see that the price breaks the upper and lower line but the candlestick closes inside the channel. Usually such candlesticks have a long shadow with extreme or exceeding the average value. You can see four examples of such “shadow breakouts”.
Obviously, in this case the Donchian channel strategy will be the inverse one compared to the classic Donchian channel trading strategy. That is while creating a “shadow breakout”, you should open long positions when the price breaks out the bottom line and a short position when it breaks out the upper one.
The first goal of the price movement is the middle point of the channel and the second one is its inverse border. In this case, you should set the protective stop order pretty close to the lines: one pip above the upper value of the “breakout” bar when you open a short position and one pip below the lower value of the “breakout” bar when you open a long position. When the price reaches the middle point of the channel, you should apply for the trailing stop order.
This strategy has an advantage compared to its classic version. Due to relatively small drawdowns and a large number of profitable entries, the day traders with small deposits may use this strategy as well.
Usually the “bouncing” strategies work best on the sideways markets. At the same time, a strong squeeze of the channels during the sideways movement is a signal to expect an upcoming breakout and a strong movement. It is worth saying that you may use this strategy (carefully) the same way on the trend markets.
So, you can see two examples of successful working out the “shadow” breakout signal. The “shadow breakout” indicates the beginning of retracement in the 1st area and its completion in the 2nd area. The Donchian channel is strengthened by a 50%-Fibo level near the lower border of the 2nd area, which greatly increases the chances of success.
Nevertheless, many analysts do not advise opening transactions against a strong trend since the chances of a reversal (including the short-term ones) are quite low and a trader jeopardizes to get a bunch of losses. It is worth opening an against-trend position if there are other significant signals of the expected reversal in addition to the “shadow breakout” such as divergence of the oscillators, or the main Fibo level reaching the higher timeframe, or some unexpected negative news, etc.
The article contains an example when the Donchian channels are broken out only by the shadow of the candlestick and the candlestick closes inside the channel. However, if the candlestick closes beyond the channel lines, you may also apply the bouncing trade as well.
Larry Connors and Lind Raschke describe one of such strategies called “Turtle Soup plus one” in the book “Street Smarts. High Probability Short-Term Trading Strategies”. The principles of how to work with a long position are the following:
- The market can reach a new minimum and close beyond the Donchian Channel. The previous minima could have been done at least three candlesticks before.
- Usually, the traders put a pending buy order on the next bar at the level of the previous minimum. If the order doesn’t work out during this bar, then the transaction shall be canceled.
- When you open a position, put a protective stop order 1 pip below the previous minima or the minima of the 2nd
- You must take a partial profit after 2 to 6 bars and pull the trailing stop to the other part of the position.
These rules are applicable for the long positions. In the case of the short one, use the opposite rules.


Hello sir!…. thank you very much sir for sharing such an important and useful vcontent.. i found it very useful. thank you once again.. great job sir..
Can you recommend a book about donchian channels
Thank you for your kindness, I have been using the Ichimoku indicator, please help me with this Donchain indicators.
Dear sir! , thank for sharing the donchian channel indicator. I found it useful & like to have this indicator
Thank you. It’s very informative. Would you send me the indicator of Donchain Channel?
very simple and easy to understand. thank you. im using this indicator this now and its clearly working. thank you.
Hey, I’m really love enjoying your content I got a question: -do you think this is suitable to use in the 5min timeframe ? and if so, do I have to watch out for the primary trend on the 1h/4h chart so I’m not getting caught by the primary trend ?
Great job sir
Loking forward to more reading on the same
I feel that this indicator will mess up my charts.
Thanks
New tool added into my toolbox
Where can I download this indicator? Can you send to me on mail?
Very impressive, well explained and easy to understand
Please send me this I try it on my MT$
Can I use it on c-trader?
Your content reads very well making it easy to understand
Good job