

We should express gratitude to an Italian mathematician Leonardo of Pisa or, as they say, Leonardo Pisano (1170–1250). To his friends he was better known by the nickname “Fibonacci” — the son of Bonacci (he also spoke to “Bigollo”, “loafer”). He is mostly known by the book “Liber Abaci”, written in the year of 1202 (“Abaca” is a counting board).
Before reading the article and writing your questions in the comments section, I recommend to watch this video. It’s not long but covers the biggest part of questions on the topic.
If you put a couple of rabbits in the closed space, how many rabbits can they produce in a certain time, given that they produce one per month, and the newly born can themselves become parents at the age of one month? The resulting infinite progression (now called the “Fibonacci numbers”) looks like this: 1, 1, 2, 3, 5, 8, 13, 21, 34, 55, 89, 144… You see that Fibonacci numbers are consistently growing.
Each subsequent number is equal to the sum of the two previous ones: 1, 1, 2, 3, 5, 8, 13, 21, 34, 55, 89, and so on. The relationship between these numbers is intriguing. Firstly, starting with the number 5, any of them is about 1,618 times larger than the previous one. Secondly, any of the numbers is approximately 0,618 next. Forex traders started to use levels of Fibonacci as soon as they noticed that fluctuation in asset prices often repeats this numerical sequence. And the repetition was so clear that the Fibonacci indicator was built into the standard settings of the most popular information trading terminal MetaTrader 4, which has been used by the vast majority of traders.
Table of Contents
How to Use the Fibonacci Levels in Forex
Traders use popular tools:
- Lines
- Arcs
- Fan lines
- Time zones
- Expansion
Most major charting programs include Fibonacci retracement levels. For now, we’ll stop at the Lines. On a scale of 0-100, the Fibonacci ratios are calculated as 23.6, 38.2, 50.0, 61.8 and 78.6. These ratios are considered as the main indicator (predicting a possible future price movement) as the price often ricochets from these levels. Picture 1 below shows a Fibonacci retracement level in an uptrend. The price reached the high, after which it retraced firstly to 38.2% and then to 50% before continuing higher.
The indicator visualizes these levels on the asset price chart and gives an idea of the future of its movement. If you like manual mode, then select the function of displaying correction levels in the program or on the price chart. Start at the bottom of the trend and drag the cursor to its top point, as seen in Picture 1. These lines can act as support or resistance levels, depending on whether the currency pairs or stocks and indexes in the stock market are traded above or below them.
Thus, all that is required from the trader is to find a trend, correctly set the Fibonacci line, wait for confirmation, and open an order. There are many ways to use this number in the trade, in our material the most universal one will be considered, which will help to make a profit on the majority of assets, under moderate market volatility.
How to build Fibonacci lines on a chart
Indicators are among the standard on the MT4; to install it, you need to select the “Insert” — “Fibonacci” tab on the top panel: Choose “Retracement”, and now they need to be stretched on the price chart (Picture 2). How profitable your work will depend on how correctly you do it. To properly expose the Fibonacci correction line, it is necessary:
- to identify a trend that has changed to the opposite;
- open the indicator;
- draw the grid along the entire length of the changing trend from the point where it had dried up and begun to change direction, to the point where it had originated.

Many insist that stretching the grid is necessary exclusively from left to right, but experience shows that there is not much difference, and if you have enough practice, then you will get it right in any case. In the first picture, the Fibonacci retracement levels were stretched from left to right, and this does not prevent us from revealing support and resistance work levels.
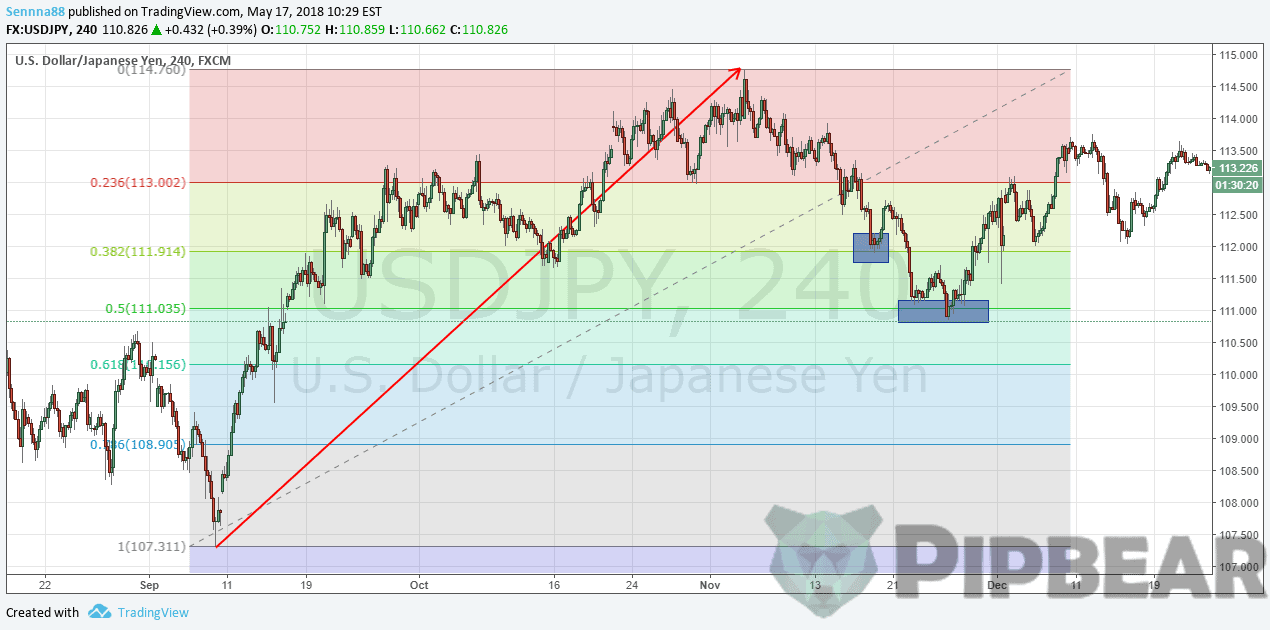
Here’s how the chart went on: Blue rectangles marked the main points in which the price retreated for consolidation. Each such rectangle could serve as a mark for entering the market and making a profit for the trader (Picture 3). To correctly set the Fibonacci sequence for the asset you are interested in, you must wait for the direction of the price movement to change, and apply the grid, focusing on the exhausted trend. As can be seen in picture 3, the price reacted to three key levels – 50, 61.8 and 78.6% retracements.

Therefore, to avoid lowering your ranking in search engines, a link to the source is required. This method allows you to eliminate false signals, and the Fibonacci lines in this case will work with even greater accuracy.
How Fibonacci levels work and how to use them in trading
That is what is so good about the Forex market: there are no clear, academic rules for work. Therefore, if you want to test a strategy using Fibonacci retracement levels, you can adapt it to your trading style. Here are the main points on which the author’s strategy is based:
- The grid is built on a four-hour schedule, based on a global trend, which can be formed in a period of months to six months.
- For daily work, the hourly chart is used, and the once built-in Fibonacci sequence also serves up to six months.
- The average time for an open order is 2-3 days, but in some cases it can exceed a week.
- All transactions are in the direction of the current trend, and the opposite to the one on which the numerical lines had been built.
The Fibonacci lines work great on all charts and assets. Whether it’s Forex, stocks, commodities it is the most used charting indicator in trading business. You do not necessarily have to follow these points — everyone sees the market in their way, and the main thing for success is to find a system that will match your perception and bring income. It is possible to use Fibonacci levels on Forex for scalping, but it should be taken into account that the less the time frame of the chart is, the more false signals will be. Therefore, for such trading, it is better to combine this strategy with additional indicators.
A pair of stochastic oscillators with standard settings 9-3-3 and 21-9-9 or a normal moving average with a period of 50 is not bad in this role (Picture 4). Here is an example of such work with the EUR/USD chart, the time frame is 15 minutes, which allows you not to leave the terminal and work, as the vast majority of intraday traders like. The author’s method is used, which is very simple but allows you to make a profit.

All transactions are in the opposite direction to the trend that was used for building. If the trend, on which you had built the grid, was bullish (for example, it is indicated by a red dashed line), then all the subsequent work will be carried out downward. Many investors believe that not every level of the lines fulfills the price schedule in the same way, and they revealed such a pattern:
- 23,6 — is the first recognized retracement;
- 38,2 — an important level, most likely the asset price from it will ricochet, for subsequent consolidation. The strong trends will bounce from this level;
- 50 — something in between the two previous ones, the probability is high that the level will work as it should;
- 61,8 — The strongest retracement level;
- 6 – similar to 38.2%;
- 6 – similar to 23.6%.

If you rely on the strength of the levels in your work, work exclusively in the direction of the trend, filter false signals with a simple additional indicator and do not fall on lower time frames, then your work in the Forex market will be highly profitable, and the trading risks are small. Of course, one should not forget about the basic rules of risk management and the psychology of trading.
Fibonacci levels in the stock market
Since many traders are guided by Fibonacci retracement levels, some support/resistance cases may turn out to be self-fulfilling forecasts. And yet it’s amazing how often the shares moving within the uptrend are rolled back to the Fibonacci retracement level, and then bounce off of it. Or, while sinking during a downtrend, they temporarily recover to the Fibonacci retracement level and then continue their decline.
Some traders use “fibs” as a benchmark for determining the level of a stop order. For example, they have their stops about a quarter of a point (or so, depending on the stock price volatility) below the 61,8% Fibonacci retracement level from the previous high. Indicators are just indicators. Look at the weekly schedule for Google, Inc. (GOOG) to understand how the indicator considered is used to determine support and resistance levels (Picture 5).

Here’s a great example of how Fibonacci lines work as both support and resistance. The correction levels of 38,2, 50 and 61,8% are calculated from the point in the bottom left of the graph and to the top of the trend. It can be seen how the rollback ends at 23.6%. From here the rally starts almost 80 points up. Also note that this level coincides with the 40-week MA or, if we move to the daily chart, the 200-day MA (40 weeks multiplied by 5 days = 200 days).
How to use the Fibonacci sequence as profitable as possible
In fact, in trading it is not so important how many successful and profitable trades you have made. It is much more important how many times you were wrong, and how you have reacted to your mistakes. And it does not matter whether you use F. levels in MT4, or Ichimoku indicator has been connected. The main thing is not to maximize profits, but to minimize losses. This is done quite simply, the main thing is to observe several rules in trading:
- never use one trading strategy, combine 2-3 simple systems;
- do not overtrade,
- do not aspire to open orders as often as possible, focus on quality, not quantity;
- try to work on time frames of at least Н1, even if it seems boring and unprofitable — “successful investments often cause yawning, not applause”, as Warren Buffett said;
- never forget about the economic calendar and the time of the release of the main news of the trading day, so as not to become a victim of the unfolding after the publication of the trend;
- conduct transaction statistics — carefully write down all your actions in the market, it will help to collect data, what you are most successful in, and what needs to be tightened up;
- increase your level of experience and knowledge — any book you see about the interbank market should be of interest to you. Remember these simple points, and try to exclude disturbing emotions from the trade.
How to use Fibonacci levels
The trading strategy based on the numerical Fibonacci series is simple enough to combine it without excessive confusion on the chart with other indicators, but at the same time it is effective and profitable. Construct a grid by using the Fibonacci levels and find out the levels of support and resistance is nothing complicated here. Trading on this system, do not slide on small time frames, filter false signals with any additional indicator, and follow the trend. This way you will achieve success!


I use fibs along with the 200,100 and 50 EMA. I look for confluence , when i see a strong fib level lining up with one of my EMA lines it’s a good entry or take profit level. when i see these levels line up, I quickly look at the order book to see a shift in momentum. works well for day trading and scalping.
someone new to Fibonacci retracement… thanks for the tutorial that helped me a lot. one question, how do you know how far to go back when deciding the high and low? one day, one week, one month, a few months?
Very well elaborated
My al time best trading tool
Wow!!….Thanks that was great
Can we use this for the cryptos
I was always taught to plot wick to wick. If it is an uptrend, start drawing your Fibonacci retracement from the point of higher high. The level will be marked as 100. Come all way down to the point of lower low; that point will be marked as 0. On a down trend, you need to do the opposite. Whether you choose to start at the top of the wick or candle body it’s important to remain consistent and end on either the lower wick or candle body. (wick to wick or body to body, never wick to body or vice versa).
super simply put soo many people use it differently as a new trader six months in this is the clearest explanation I have seen ! thank you !