

Practical use of the Heiken Ashi indicator and the example of creating the simplest trend strategy with its use.
Before reading the article and writing your questions in the comments section, I recommend to watch this video. It’s not long but covers the biggest part of questions on the topic.
This article will be devoted to the use of the Heiken Ashi indicator in the trend trading strategies on the Forex market. We will discuss its advantages, disadvantages and creation of the simple trading system based on the indicator.
Table of Contents
WHY DO WE NEED THE HEIKEN ASHI INDICATOR?
It is of no secret that the most safe and profitable way of trading is to follow a trend. Consequently, trend identification is the main element of the trader’s work. The Heiken Ashi indicator (or the “middle bar” indicator) is one of the tools, which serves as the basis for forming a chart with modified candlesticks and more apparent areas of the trend movement.
CALCULATION FORMULA FOR THE NEW CANDLESTICKS
Ordinary candlesticks are formed with due account for the opening and closing prices, and maximum/minimum price over a certain period. Each bar of the Heiken Ashi indicator is calculated by the following formula:
- The candlestick closing price = (Open + High + Low + Close) / 4. The average price of the current bar.
- The candlestick opening price = (Open (previous bar) + Close (previous bar)) / 2. The middle point of the previous bar.
- The candlestick maximum = the max value between the opening price, the closing and the maximum price.
- The candlestick minimum = the min value between the opening price, the closing and the minimum price.
Now let’s compare the same segment of the market, consisting of the ordinary candlesticks and the candles calculated by the formulas of the Heiken Ashi indicator.
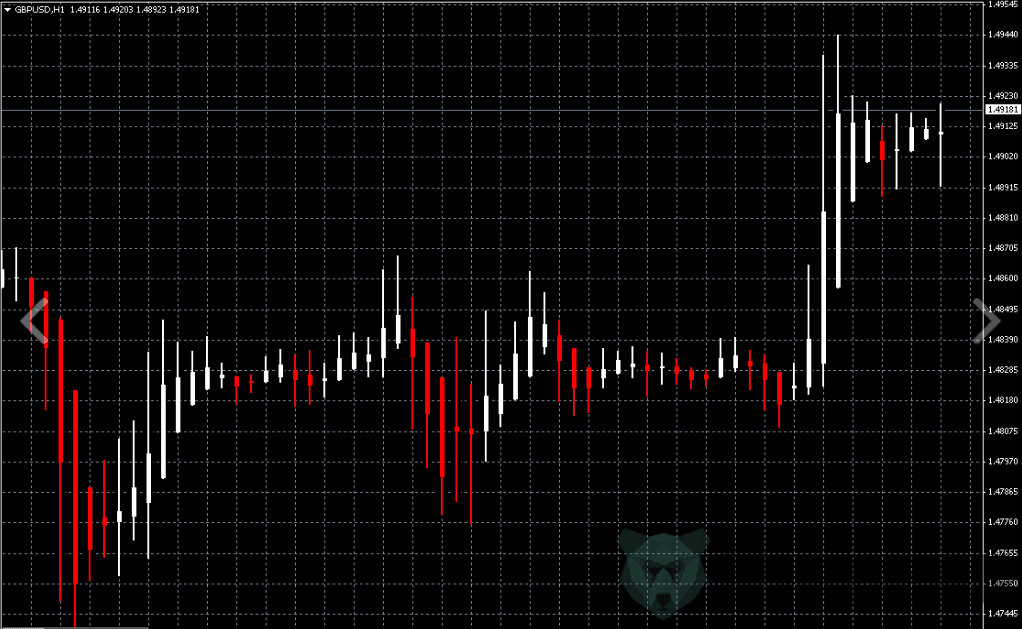
The ordinary chart:

The same chart area with the use of the Heiken Ashi indicator:
If you compare both figures, you can see that the second area has become less colorful.
SIMPLE TRADING STRATEGY BASED ON THE HEIKEN ASHI INDICATOR
Let’s take a look at the simple trading strategy using the Heiken Ashi indicator. You can increase the effectiveness of the trading strategy by using additional indicators.
SIGNALS FOR OPENING LONG
- The white (bullish) candlestick of the Heiken Ashi indicator is formed (you should better use a day or weekly timeframe)
- Open long with the fixed Take Profit order and the Stop Loss order (30 points each) on the next candlestick.
SIGNALS FOR OPENING SHORT
- The red (bearish) candlestick is formed.
- Open short with the fixed Take Profit order and the Stop Loss orders (set the same parameters as you did in the previous case).
The simplest trading strategy with the use of the Heiken Ashi indicator:

Preliminary calculations prove that the average percentage of the successful trades opened by the strategy described above fluctuates around 75%.
For example, if you open by 30 currency pairs at the beginning of each week (taking into account that 75% of transactions are profitable), the average profit will be (21 * 30 points) – (9 * 30 points) = 630 points per week.
Of course, the use of the Heiken Ashi indicator is not limited to the described strategy. Each completed candlestick can be used as a direction for opening a trade in the next trading period (depending on your favorite timeframe). If the previous day candlestick was white, you should open up the next day, if it was the red one, you should open down.


Haikin Ashi is a awesome bar. I earned a huge money today by using this HA
Amazing strategy. I would be really happy and greatful if you teach me the analysis for commodities.
Thanks for sharing. Do you have an EA for your strategy?
Good strategy. How do we identify the liquid stocks that are to be traded on intraday basis.
what is the best times to trade this strategy!!! thanks for your help and strategy!!!!
excellent tutorial easy to understand but i have one doubt that there is a little difference in price of normal candlestick and heikin ashi. so how to judge the price while we go for trade..plz let me know..Thanks
Hi Sir Does this heikin Ashi work on futures? Or do you recommend for fx only?
Thank you sir
When comparing heiken ashi with ordinary candle sticks, I find opening, high, low and closing readings are different in both types of candles. Will this affect not affect entry and exit and profit taking in any way ?