

Ichimoku Kinko Hyo is the Ichimoku indicator that can be used to analyze price charts at any time intervals. This is a combination of five lines, three of which are completely independent, and two are linked together, forming a separate area. Before talking about Ichimoku signals, let’s look at these elements closer, not to get confused with the titles and essence of the Ichimoku lines.
Before reading the article and writing your questions in the comments section, I recommend to watch this video. It’s not long but covers the biggest part of questions on the topic.
Table of Contents
Ichimoku Lines
- Kijun-sen is a major line that shows the availability and vector of long-term trends. If it moves upward, then the trend is upward and vice versa. If Kijun-sen moves alongside with the price, this a signal of the flat market.

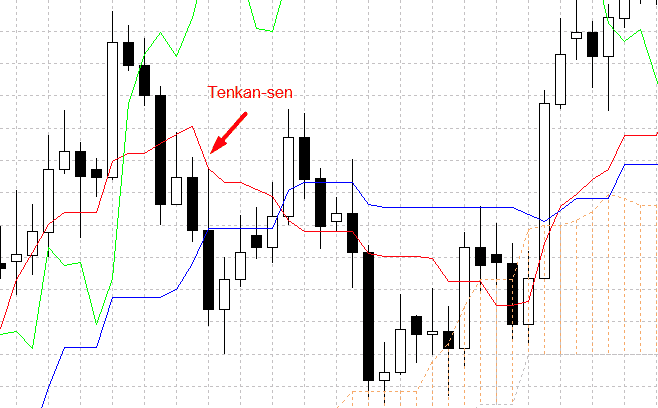
- Tenkan-sen is a reversal line indicating the presence and direction of a short-term trend. It is calculated similarly with Kijun-sen – the sum of the maximum and minimum price for the selected period is divided by two. Tenkan-sen takes a smaller time interval.
- Chinkou Span – a linear chart, built at closing prices, and then shifted by a certain number of periods (26 by default). It allows comparing the current closing price with those that were a few bars ago. Due to Chinkou Span you can correct or turn in time.

- Senkou Span A is the pre-emptive line, which is the first boundary of the so-called cloud or Kumo.
- The second boundary is formed by Senkou Span B.

Depending on the position of the price, these “riding horses frisking in front of the carriage” (the vivid translation of their title from Japanese) act as resistance or support levels. Kumo is usually highlighted by red or blue strokes on the chart. If the price is inside, you can conclude the flat state. If it is below, then there are more buyers on the market, if it is above then sellers predominate. The wider the cloud, the higher the volatility is.
Chinkou Span Signals
Working with Ichimoku experienced traders relatively rarely pay attention to this line, but thanks to it you can receive important signals, such as:
- a cut-off price;
- crossing the price chart;
- deviation from it.
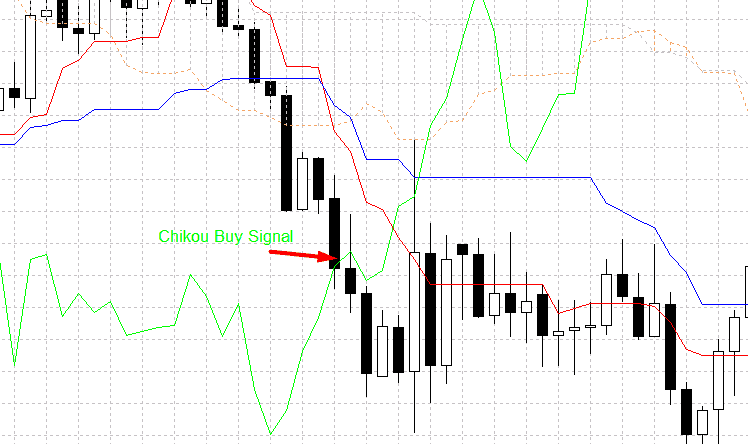
The first signal is based on the fact that the Chinkou Span line represents the current price, which is offset by several periods. Past prices can be considered to be the levels of resistance/support. As soon as the line touches them, a message that the current price has reached the level.
- If Chinkou Span came from above, it makes sense to expect a new trend, which will be a downtrend.
- If the price is cut off from below, the formed movement shall become upward. The line must pass through the body of the candles. This signal does not appear so often, therefore its appearance is significantly doubled.
In cases, if Chinkou Span deviates from the price chart, it is possible to predict its future turn or correction. You can only observe how much the discrepancy is compared with past data. The greater is the deviation, the higher is the probability of a correction.
The signal is quite weak, do not make a decision based only on it.
Kijun-sen and Tenkan-sen signals
The Ichimoku signals associated with these lines can be caused either by their alignment in a certain sequence or by crossing.
Based on how the Ichimoku lines are located, you can identify the vector and strength of the trend. If Tenkan-sen, Kijun-sen, and Chinkou Span B (the signal of three lines) move after the price in one direction from top to bottom, then it is possible to define an uptrend. In such cases, it is worth considering the possibility of buying at the time of the price rollback to one of the lines.

If the chain is turned in the opposite direction, then the trend is downward, and it can only go for sale. At the stable tendency it is possible to keep positions open until the sequence is finally destroyed. In such a state, you can increase volume, close it partially or use a trailing stop. In general, this signal is the most effective for maintaining the position.
Crossing the lines of Kijun-sen and Tenkan-sen is called crosses. If the Tenkan-sen passes Kijun-sen from above, a death cross is formed.
- Its appearance is considered to be a signal for sale.
- If the line crossing occurred from below, a golden cross appears which calls for a buy.

This type of signal is constantly late, so you should not take the lead exclusively on it while trading. In addition to delays in entrances and exits, ad you must be prepared for numerous false alarms. However, they can be filtered, focusing on the Kumo cloud. For example, if the price is above this area when the “dead cross” appears, the message can be ignored.
Senkou Span Signals (A and B)
Some Ichimoku signals can be obtained by paying attention to Senkou Span and the cloud they create. The color of the Kumo shading depends on which line is on top. If it’s Senkou Span A, then the cloud is usually red, if Senkou Span B, then it is blue. It is to be recalled that these lines perfectly show the location of the levels of dynamic resistance or support, which is perhaps the most important for many users of the Ichimoku indicator.
In combination with additional analysis tools, for example, Fibonacci levels, you can achieve even more impressive results, especially if it is a matter of working on long time frames.
Signals occur in the following cases:
- the price moves inside Kumo;
- lines cut one another;
- the price breaks Senkou Span B.
If the price in the cloud area, you may talk of the formation of a sustainable trade corridor, in which either its borders or inside Kijun-sen or Tenkan-sen can be the pre-emptive lines.
Trades can also be made while moving on Kumo and at the moment of crossing one of the support/resistance levels. The choice of strategy is determined by the trading methodology.
As articulated earlier, the Senkou Span lines are preemptive. At the moment of their crossing a signal is formed, based on which it is possible to predict the possibility and nature of the change in the current trend. If the faster line breaks the slow line from below, the probability of a bearish trend is high. Otherwise, we should expect the formation of a bullish trend.
These signals are considered to be very strong. The percentage of starts and finish of the corrective / impulse movements caught with their help is quite high. At the same time, they should be used with the utmost care, however, like all other means of technical analysis. Best of all to use it just as a confirmation signal. For traders without sufficient experience and ability to assess quickly the situation on the market, in general, it is better to use them at a minimum.
One of the most important signals of the Ichimoku indicator occurs when the price chart breaks the Senkou Span B line. The latter is calculated as the average price for recent periods. If their number is large enough, we get a long term trend. That is why the breakout of the line is a very powerful message, announcing the onset of a new global trend.

This line is a serious indicator level of the demand/supply. To overcome it, the price often has to make several approaches, having spent thus a lot of time. If the breakout is successful at the first attempt, volumetric candles or impressive gaps are formed. In many cases, the price comes again to the overcome level, to test it again. Either way, it is contraindicated to open against the movement at the breakout of Senkou Span B.
Tips for working with Ichimoku signals
Ichimoku signals can be divided into weak, neutral and reliable.
The first group refers to the reaction to the price contact with the cloud line. Some traders recommend immediately opening the position at this moment, even without waiting for further movement. However, it is not necessary to hurry. As soon as the price goes into the cloud, in most cases there is a strong breakout, and its further behavior is difficult to predict. In such situations, you can earn too. The main thing is to put the stop losses closer to the cloud and monitor closely the further development of events. While the movement continues in the same direction, the position can not be closed.
We can observe an example of a neutral signal in cases if the Kijun-sen line crosses the Tenkan-sen from below (the price is in Kumo at that time). On the one part, there is a fairly obvious message, on the other – the price is in the zone of uncertainty. How to behave in such a situation – to act or wait? Experienced traders believe that it is worth starting to trade, not forgetting about the features of the cloud. As soon as the price starts to approach its borders, the probability of a reversal movement increases as much as possible, so you will either need to be reinsured with stops or simply close the position.
If we talk about reliable signals, then the strongest is the price out of Kumo. At this point, usually there is a powerful impulse, reacting to which the trader gets the opportunity to enter a new long trend at the very beginning. Seeing the breakout, you should open up after it, as quickly as possible, of course without forgetting the classical safety points.


Great explanation of a complicated, confusing & non-user-friendly indicator. I get a headache just looking at it.
Since I don’t like a messy chart, I only use the cloud on my chart. And then I play s/r with an rsi matching up too so I can have a lot of confluence
i use it, i love it. its the only indicator that helps me to stay profitable over a long period of time. its awesome if you use Fibonacci with it. it gives you buy or sell signals with different levels of momentum
Thanks, best tutorial about ichimoku
Pretty good explained. That cleared some things out for me but I have learned some basics a few days ago and it was easier to me to understand what you are talking about …
Lol, keep trading ichimoku. Youll never make money. If youre serious then you should use market structure and chart patterns with overbought and oversold conditions and fibonaccis and candlesticks. All this machomoku sounds fancy but youll lose all your money
Great article
Thanks
Well done
thanks keep it up, you make it so simple and i will never love it less, in fact the complication is what attracted me more and i must confess this is the best i ever used.