

The Kagi is a Japanese charting template of market analysis based on analyzing the prices of the previous trading sessions. It is a very effective tool (as well as the Alligator indicator) for determining the current trend. It shows the price movement change in the form of the thick and thin vertical lines connected by the horizontal lines of the same length.
Before reading the article and writing your questions in the comments section, I recommend to watch this video. It’s not long but covers the biggest part of questions on the topic.
This method of market analysis was created in Japan in the end of the 19th century. It was the time of the trading arose in the country and the thoughtful players started to develop new analysis tools. The Kagi chart (Figure 1) fell into the ranks of the technical analysis tools soon after the candlestick chart.
The rice trading was a basic one in Japan in the 1870th and the Kagi chart became a worthy alternative to the existing tools of determining quotations for this product.
The Kagi has the L-shaped form on the price charts. This form is very similar to the wooden plank used for paper jogging. This plank is called a “Kagi” in Japanese and thus origins the name of a new analysis tool of the stock exchange quotation.
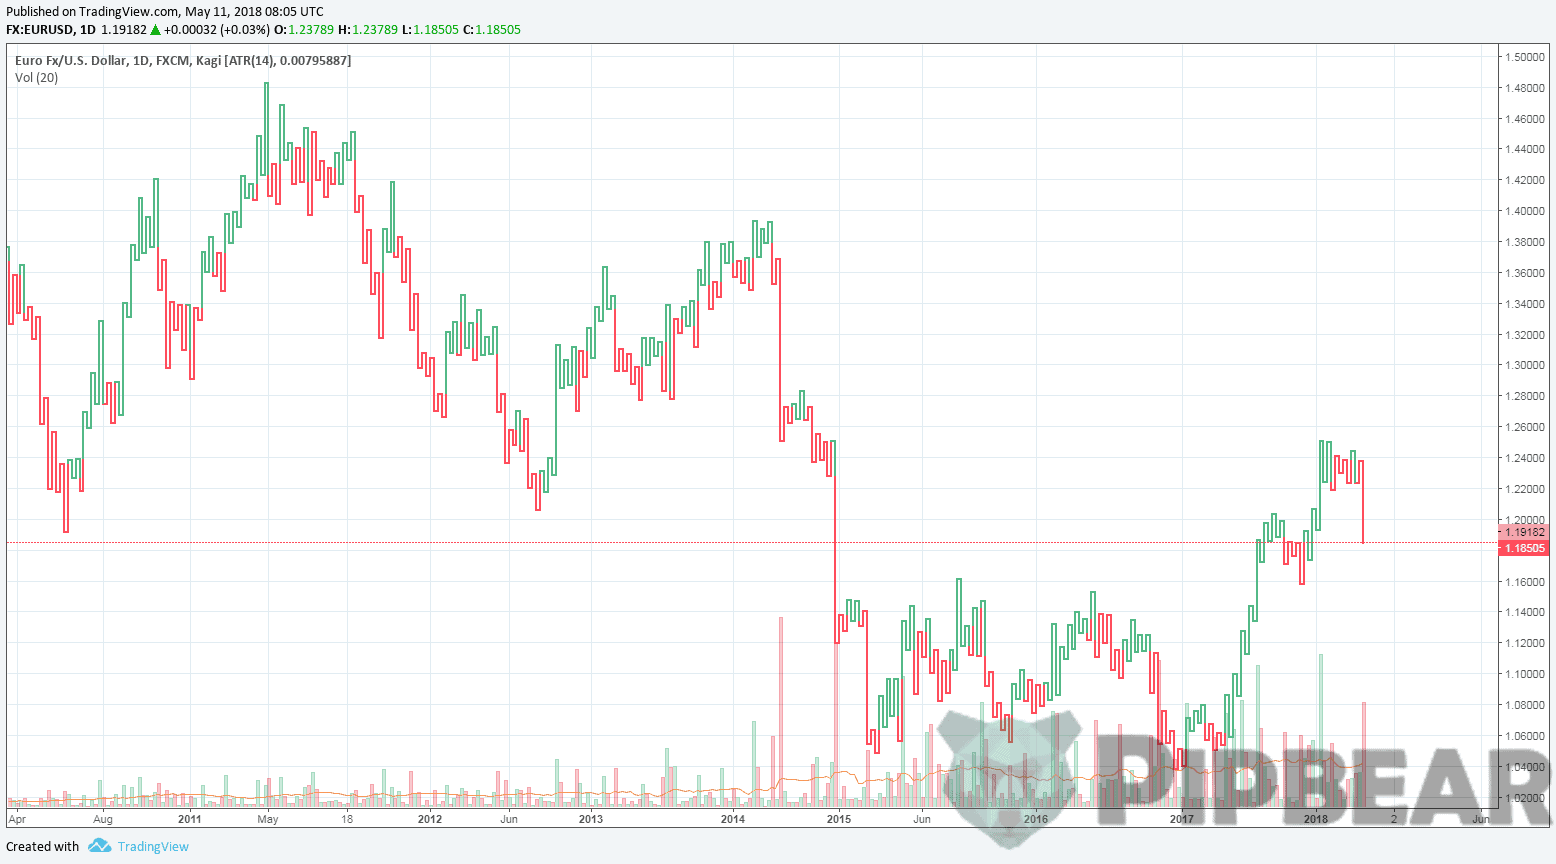
Table of Contents
Principles of Drawing the Kagi Chart
You should not draw an analogy of the elements of this chart with the bars or the Japanese candlesticks. The Kagi chart does not have a time axis and forms with no connection to the time intervals.
It looks like a continuous broken line changing its direction strictly in a horizontal or vertical order. The Kagi chart structure contains four types of lines, two of which are vertical and two others are horizontal.
These lines have the following terms on the schematic chart:
- “Yang” is a thick vertical line;
- “Yin” is a thin vertical line;
- “Shoulder” is a horizontal line using which the price advance line connects to the price decline line;
- “Waist” is a horizontal line that connects the vertical price decline line to the price advance line.
Since the Kagi chart is usually independent of the timeframe indicator, the lines are formed until there is a sign of the trend change.
The chart is made upon the following principles:
- It is oriented at the quotation size. In such a case, the lines of the chart are formed upon the opening or closing price of the trading timeframe, or upon the peak price values.
- Criteria of the price reversal and the threshold settings is the distance that a trend should pass in the reversal direction from the fixed point for making a new Yin or Yang line. This parameter is usually set in percentage terms or points.
- Since there is no timeframe indicator, the vertical line keeps growing until the price changes its direction (Figure 2). In the case of the price reversal, the Kagi chart creates a horizontal line after the vertical line for transfer to the advance or decline line.

What Does the Kagi Chart Show Us?
A trader may use this tool as an independent analysis tool. Also, the Kagi chart may display high efficiency in determining the market entry points.
The vertical lines of the Kagi chart may display a certain timeframe but its length is not set by the specified parameters. This chart shows the trend of power, volume and volatility while forming the lines.
The thick vertical lines display the market activity while the thin vertical lines indicate a decline in sales. In addition to this, the Kagi chart also shows a trader of the trend reversal point by making the shoulder and the waist (Figure 3).

Analysis using this indicator is based on the fact that the lines display the change in the minds of the market players. The trend power goes down, the thick lines shifts to the thin one, and that’s what happens when the market is weakening and the trading volume is decreasing. The reverse is true when the large players with large investments come to the market, the thin line of the chart shifts to the thick one.
The rules of opening positions using the Kagi chart signals are based on the price movement changes. However, it is quite difficult to calculate the pending order parameters as the chart is not bound to the timeframe.
When the traders’ mind changes, the thickness, and direction of the lines change along with it. At that moment, the line shifts to another one by the means of the horizontal should or waist
Also, the Yin and Yang lines may display the trend of strengthening or reversal. If the line gets thicker and still moves upwards, then the trend is strengthening. When the trend is getting weaker, the thick line shifts to a thin one and keeps its direction. A trader may also decide on closing positions by changing the lines’ thickness.
Short description of the MT4 Kagi indicator
The Kagi indicator as well as the Kagi chart has the form of the vertical lines of different thicknesses. This kind of indicator has an easy working algorithm that makes it possible to install it to the MetaTrader 4 terminal (Figure 4). A trader may find a good comfort level by using different versions of the indicator:
- Directly on the price chart.
- In a separate indicator window.
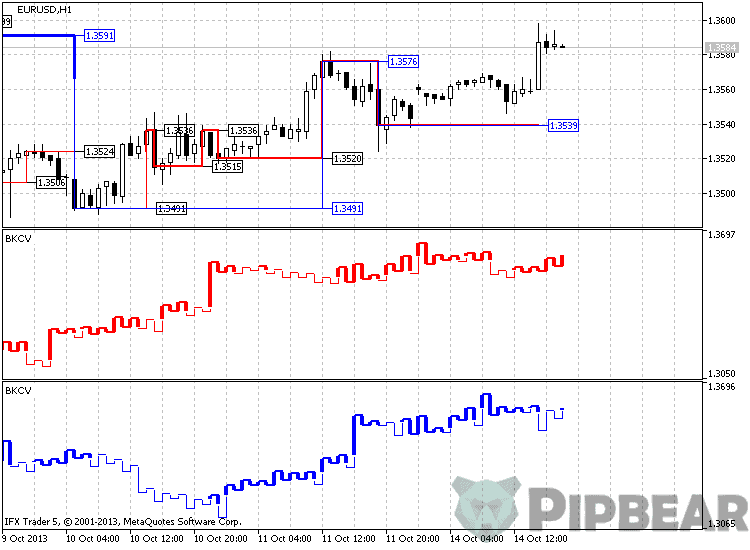
Analysis using the Kagi charts may have varying utility. When the indicator is set in the separate indicator window, you will need to set the length of the curved line, color scheme and the threshold type (which is the most significant parameter).
The disadvantage of the fixed price threshold is that a trader must always draw a comparison between the indicator’s signal and the real asset quotations.
At the same time, the higher-end software makes it possible to use the threshold correlation in the percentage terms and simplify analysis. Concurrently the Kagi indicator in the quotation chart window displays the ratio between the chart lines and bars in a more convenient way. You do not need to apply these signals to the current time.
The Signals of the Kagi Indicator
The Kagi indicator signals are only applicable to the dynamic market and the currency pairs of high volatility whose charts contain the frequent trend changes. The signals of this indicator are not very useful in the case of the tranquil market and during a prolonged flat as you need confirmation by other analytical tools to determine the entry points. Still the Kagi indicator may show you the current mood of the market through the thickness of the vertical lines.
Steve Nison wrote a line Buy if you see the Yang line. Sell if you see the Yin line in his book and that is the most accurate advice ever about the correct recognition of signals. However, we need to make some adjustments, since the thickness of the lines can change both in case of uptrend and downtrend.
That is why you should perform the purchase operations only when the indicator has formed the shoulder or the waist with the thick line followed by a vertical line of the same thickness. The same rules apply for the selling operations.
Some modified Kagi indicators also have additional signals in the form of the color change. When the trading volume and volatility go up, the signals change the color along with the lines’ thickness hereby displaying the quotation rising or falling.
Conclusion
Many traders consider the Kagi indicator strategy using no indicators at all. However, this claim can be true in case of making the chart manually, which is quite difficult because of the labor intensity of the process and complexity of the calculation algorithm. On the other hand, we do not need that as there is a Kagi indicator that has already proven its efficiency. In any case, complex and solo use of the Kagi chart and the signals based on it make the trading more advanced.


Thanks Kagi works better on apple, on atr 1, it seems to me you have to have more expensive stocks and then it works better, like say with google or amazon etc
A path to tragedy and losing your account, some of these complicated indicators are meant to mess up with people’s minds
Will keep trying each of these trading methods
Good! thanks for sharing
I still don’t get this concept…. I will re-read may be I may understand
Clear charts, clear explanation….. good job
God bless sir…..
Thank you for sharing such valuable information with the public and the larger forex family
To be very honest, I feel this course not a perfect for me. There is so much information here to digest