

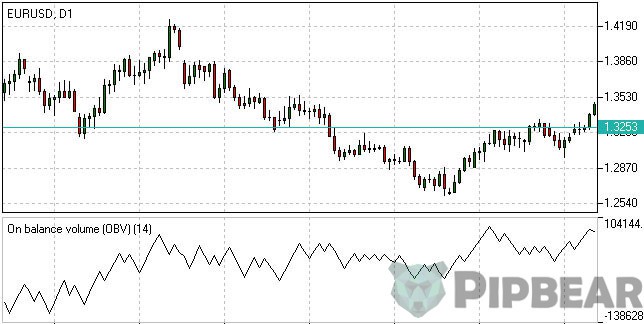
On Balance Volume (OBV) indicator is a simple classical oscillator that shows price fluctuations based on changes in market volume over a certain period.
Before reading the article and writing your questions in the comments section, I recommend to watch this video. It’s not long but covers the biggest part of questions on the topic.
Cumulative volume principle, on which basis the instrument was built, was firstly introduced in 1946, but it gained wide popularity in 1963, after the publication of J. Granville’s book “New Strategy of Daily Stock Market Timing for Maximum”.
Table of Contents
OBV description
The theory according to which a serious change in volume always precedes a strong price movement became the impetus for OBV indicator creation. The market does not have to react immediately.
For example, in the situations when the largest market participants who own certain information start to invest in assets which most other participants are trying to get rid of. I.e. the volume has already increased substantially, but the price movement vector is directed downwards for a while by inertia.
When the critical mass accumulates, the trend is sharply reversed and becomes upward. Small and medium investors immediately join it and make it even stronger. When the large players decide to get rid of their assets in this way, there is arises a mirror situation.
On Balance Volume Settings
The balance volume indicator is included in the basic package of the most popular platforms, including Metatrader.
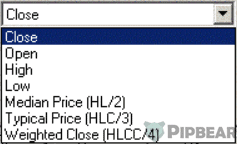
It’s necessary to set three basic parameters to configure it:
- “Apply to” – here is set the price on which basis the curve will be built. High and Low are the bar’s highs and lows, Close and Open are the bar closing and opening, etc.
- “Lock low/high” is used to set the lower and upper indicator levels.
- “Style” – here is chosen the curve appearance on the chart.
The default parameters are not recommended to be changed, but this depends on each trader’s point of view.
It’s not required to independently calculate OBV indicator’s value, but let’s see the way this is done, especially since the formula is not too complicated just to get a general understanding
If the closing price is higher than the previous period’s one, its value is added to the indicator’s one. If the price is less than the previous, then the volume of the current bar is subtracted. In this case, the result will be negative. When the prices are identical, the chart shows a straight horizontal.
Tick volumes indicators are used when making calculations for the Forex market.
The main disadvantage here is that the trade is equal to one tick, regardless of its value. Roughly speaking, buying/selling for a million is equal to buying/selling for a dollar.
Of course, such an equalization does not contribute to an objective assessment, but it must be accepted as a reality. That’s why it’s better to use indicators for a day, a week and other long timeframes. The volumes values are balanced there. It should be noted that special attention is not paid to numerical values when analyzing OBV, as a rule. The trader is guided exclusively by the curve’s behavior.
Signals or the way to use OBV indicator
The indicator can be used to:
- confirm the current trend;
- obtain signals of divergence and reversal of the trend.
When each new high/low of the price chart coincides with the corresponding extremum of the indicator, it means the presence of a stable upward/downward trend.
If the vector is upward, it’s possible to open a long, if down – short.
Of course, the trend confirmation is not a signal to trade, but just useful information for consideration. The indicator does not go beyond the boundaries of a certain horizontal corridor for a long time and does not form successive peaks/troughs while being in the flat state. Their market doesn’t have any strong trends during this period.
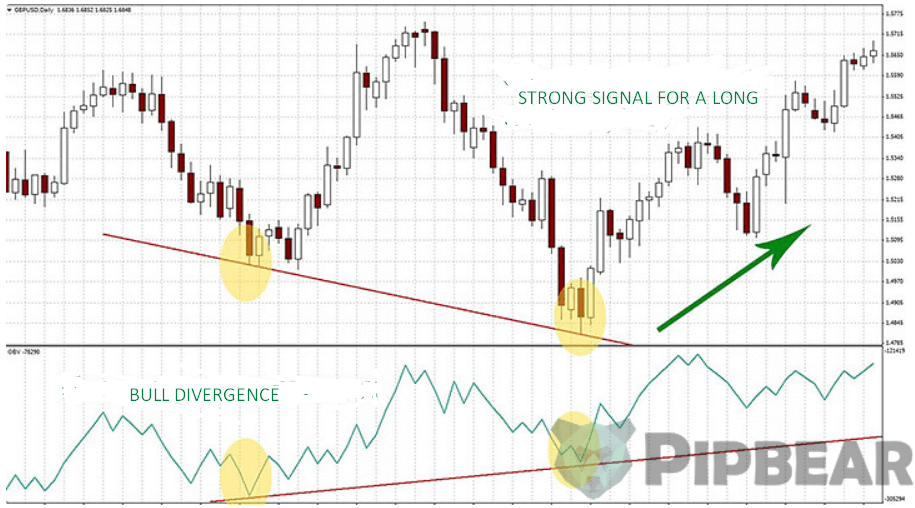
There appears a “lack of confirmation” or a divergence in cases when the OBV curve does not keep pace with the price movement. It is observed either at the top of the bullish market or at the bottom of the bearish one. In the first case, the chart reacts with a slight decrease in the price growth. If the situation repeats at the next high, the price movement has an inertial character and soon there will occur a reversal or correction.
This means it’s necessary to look for a moment to open shortly. If the price and OBV curve are synchronously updating low by a low but the latter starts to grow a little at a certain moment, there is formed a bullish divergence. This is the most appropriate time to open long. The upward continues by inertia and soon the price will start to rise.
Trades are closed immediately after vector changes confirmation by other means of technical analysis.
Divergence is the only, truly significant, independent signal of On Balance Volume, so it’s worth treating it with the due attention.
Rather often the indicator’s users draw overbought/oversold levels on the chart. The intersection of any of these lines may mean a rapid trend reversal. If the upper level breaks from the bottom, there is a signal for a short.
If the lower border is crossed from above, there is a signal for a long trade. In this case, there is always a risk that the trend will be too strong and the price will continue to move in the same direction.
Conclusion
OBV indicator is not recommended for short periods. There are strong distortions, depriving the work of special practical importance even on the hour timeframes. We have already discussed the reason for their occurrence above – a high probability of a serious discrepancy of “money” and “tick” volumes indicators. OBV is used very rarely as an independent means of analyzing.
It is usually used as a confirmatory indicator for the trend vector determination. The ideas which the tool is based on have been used in many other, more complex and effective programs. For example they include Cash Flow Index and Accumulation/Distribution, Bollinger Bands and others.


come up with more reading resources sir. I Love your presentation
Hello, i m regular following your page and happy to see you doing what you do best; can u give me some ur social info where i can follow you closely. thanks
Hello, i m regular following your page and happy to see you doing what you do best; can u give me some ur social info where i can follow you closely. thanks
This is clear, thorough tutorial you’ve put together here. Thanks for taking the time and trouble to put this together!
Excellent introduction to OBV that works very well with Volume Price Analysis. Thanks,
Very easy to understand video. Thanks.
Excellent skills; Excellent Content; Excellent Delivery
Excellent
I always thought forex was hard till I came across your content
Thanks for sharing your thoughts and skills,