

The Price Rate of Change (RoC) indicator is a classic oscillator. This is one of the simplest and most reliable tools used for figuring out the mood of the market players. If the chart curve is growing, then the overall tone is quite optimistic and we can expect a start or strengthening of an uptrend. If the value is falling, you should get prepared for a prolonged downtrend. The indicator displays the price fluctuation of an asset (shares, currency pairs, futures, etc.) over a certain period.
Table of Contents
Calculation formula
The Price RoC indicator can be applied on any timeframe with the periods from hours to months. It is calculated as the ratio of the current closing price to the similar value of the previous period that has taken place a few buckets ago:
ROC = (Pt / Pt–n) х 100%
The standard formula reflects the increase in the asset value over the period under review. Besides, there is such a thing as the normalized RoC. It displays the profitableness gained from the investments to the asset over the same period. The most popular timeframes are 12 and 15 days as they are most convenient for medium and short term trade.

Depending on the calculation formula used, the indicator chart is placed at the level of either one or one hundred.
Signals
You can get various information on the current trend from the indicator’s signals:
- When the chart crosses the line 1 (100) from above and keep going down, the downtrend is getting stronger;
- If the price is growing on the levels below 1 (100), then the Bearish trend is about to close;
- If the price reverses in the deep, then the price fall is slowing down and the sharp trend switch is very likely to come;
- when the indicator crosses the line 1 (100) and keeps growing, we can talk about strengthening of an uptrend;
- if the price reverses down in such high zone, so the trend is slowing down and is very likely to change its direction;
- when the price starts to fall to the level 1 (100), it is a sign of the trend growth slowing down.
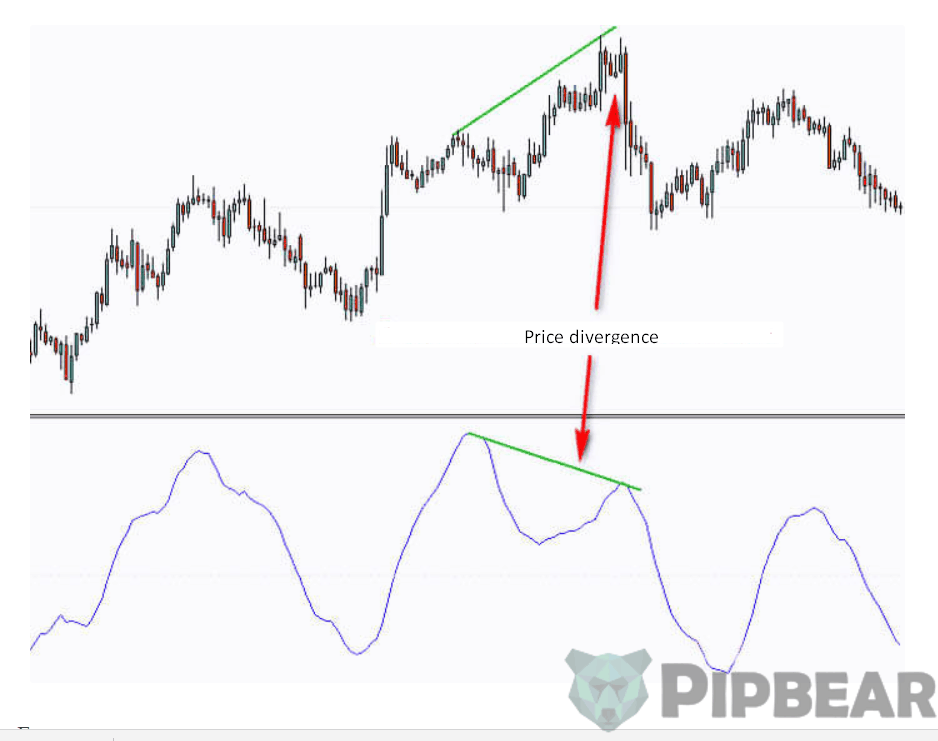
One of the main advantages of the RoC indicator is the opportunity to receive divergence signals that occur because of the discrepancy between the price and the indicator charts.
If the prices have fallen to a new low and the “bottom” of the indicator has grown about the value of the previous period, you should start right away to look for an entry point to buy. If the prices reach a new high while the RoC indicator shows a slight decrease, you should immediately start selling.
How to Use Roc Indicator
If you are working with this oscillator, you should not rush to open the transactions. You must react to the signals only after they are confirmed by other technical analysis tools. The RoC indicator can be used not only as a trend indicator but also as a catch for the market direction changes.
In the first case, you will receive the signals about the trend status when the line 1 (100) is crossed. I only have to add that the indicator chart rise through the classical level gives us a message about the opportunity to buy while lowering of the indicator chart is a sign to sell.
Accuracy and the amount of the received signals depend directly on the period’s value.
The shorter the timeframe under consideration, the more sharp is the oscillator’s reaction to the price changes.
A side effect of such hypersensitivity is a large number of false messages. The main disadvantage of the large periods is that you won’t get many signals and they will be with time delays. If you want to set a limit to the number of false calls on the short periods, you may set additional levels above and below the classical line. Thus, the signal for buying will not be generated immediately after crossing the line 1 (100) but it will be generated only when the “plus” threshold is reached.
You trade selling the same way. Such screening will help to get rid of the noise and simplify a trader’s work.
By the way, sometimes breakouts of the trend curves appear on the indicator faster than on the price chart. You can also use it to enter or exit the market on time.
The RoC indicator can also tell you about the trend changes. As we already know, a price reversal right above the line 1 means that an uptrend is likely to end. The higher the reversal occurred, the more accurate this signal, which means that you should think about selling the asset.
The same rules apply to the selling transactions. The lower the reversal below the line 1, the more rational it is to buy.
You can put additional levels of probable oversold/overbought to simplify the determining of the reversal points. The arrangement of the lines is determined individually. The main requirement is that the RoC indicator should be in these zones no more than 10% of the time.
Conclusion
The main disadvantage of the RoC oscillator indicator is that it reacts to the same price twice so the false signals are just inevitable. This is a typical problem of all the indicators of this kind. You may minimize it by using the modifications of the tool that compares not the prices but the values of the exponential moving averages. In this case, the signals are not generated too often but their accuracy is much higher. This kind of oscillator works well but it requires fewer unnecessary actions.
In general, you should experiment with the tool settings first to achieve the best frequency and quality of the signals. It is also important to take into account the volatility of the asset. The higher it is, the longer the period should be. Conversely, if the price often changes, you should better work on the shorter-term and intermediate-term timeframes.
he main advantages of the RoC oscillator are its simplicity of adjusting and applying as well as the capability to provide clear and unambiguous signals about the trend behavior. It can be used both for short-term and long-term trading. The tool can be perfectly used in conjunction with many technical analysis tools and significantly simplify the trader’s visual perception of the market situation.


A clear concept about indicators means earning more money. And its very vital for initiating the buy and sell positions.
Thanks for sharing
Wonderfully packaged
New knowledge and skills everyday…. Thanks thanks appreciated
Wow…wow…wow ! Words would never be enough to say how much I appreciate the information in this tutorial
You are amazing and I wish more people now a days would be genuine and helpful like you
Very valuable info!! Thanks fir breaking it down from the beginning!
Pipbear you have taught me so much and saved me so much money in paying to learn the stock market. Your my go to when it comes to learning something. Thank you so much for sharing such powerful content