

Those traders, who prefer to trade with a trend, face a problem of receiving timely information. It’s not uncommon that a trader mistakes the beginning of a trend for a minor price fluctuation. They miss the right time for entry and open a position when the price has already moved a significant distance. As a result, a trader fails to lock in a profit.
Before reading the article and writing your questions in the comments section, I recommend watching this video. It’s not long but covers the biggest part of questions on the topic.
One way to solve this problem is to use a trend indicator (e.g., ADX) to assess the price momentum. However, ADX has a serious drawback: it generates lagging signals.
How about Range Action Verification Index, or RAVI? By elaborately scanning the market, this wonderful tool can identify a strong trend at its earliest stage and filter out flat price movements.
RAVI was introduced by Tushar Chande, a renowned trader of Indian origin. Plus, Chande designed the Aroon trend indicator and Stochastic-RSI.
Change is known for his unconventional approach to developing trading indicators. His prediction tools are very different from standard indicators available in MT4. Based on a different calculation methodology, Chande’s tool gives traders a new perspective on the market.
Let’s find out how RAVI works, what algorithms it uses, and how we can apply it in our Forex trading.
Table of Contents
RAVI: General information
Trading platforms, including MetaTrader, don’t include RAVI in their arsenal of tools. However, you can easily download it on the MQL website.
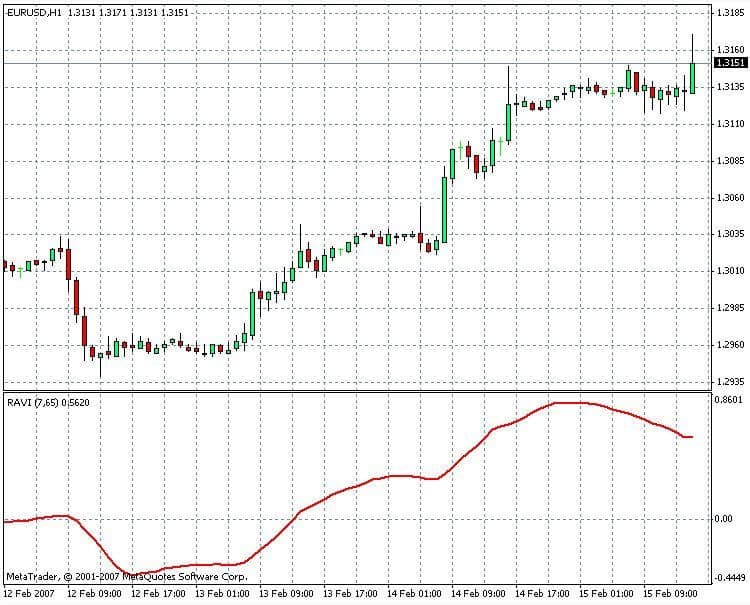
On a price chart, RAVI is plotted as a line that moves between upper and lower boundaries, like most oscillators.
Calculations
If you look at RAVI settings, you’ll only see two variable parameters:
- Maslow – slow moving average
- fast – fast moving average.
Change recommends using the following values: Maslow = 65, MAfast =7. Note that the author used these settings for daily timeframes. Why precisely these values? The answer is simple: 65 days make up a calendar quarter, and 7 days make up a week.
The indicator is calculated as follows:
RAVI = ((MAfast – MAslow)/ MAslow) * 100%.
As a result, we get a percentage ratio of averaged quarterly closing prices and weekly prices. RAVI works as MA divergence: a growing RAVI indicates that bulls are taking over, whereas a decreasing Ravi means that there is a shift from bulls to bears.
RAVI levels
To make sense of RAVI percentage ratios, Chande recommends using two sets of levels:
- 0.3 and -0.3.
- 0.1 and -0.1.
Which set of levels to use depends on the market you’re trading in.
These are the rules for interpreting the behavior of the RAVI line:
- If the line goes above the 1 (0.3) level, there is a strong uptrend.
- If the line goes below the -0.1 (-0.3) level, the price is heading downwards.
- If the line moves between the two levels without crossing them, the price moves in a trading range (flat).
How to use RAVI in trading
Knowing the calculation method and the key levels, we can outline several ways to successfully use RAVI in trading.
Key level crossing
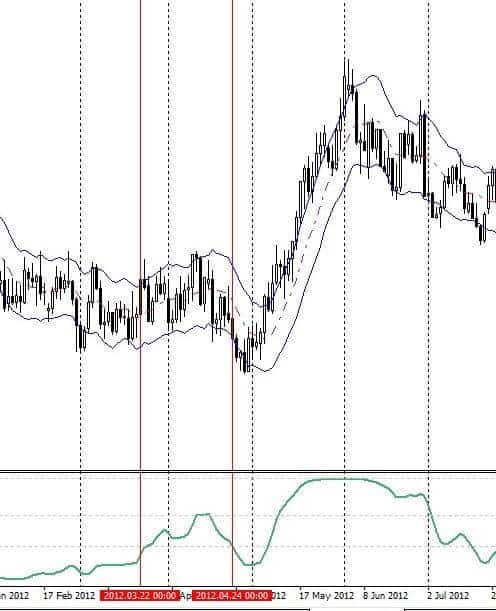
If the indicator leaves its trading range and crosses the 0.1 (0.3) level, this may indicate the end of flat price movement and the occurrence of a new bullish trend. If RAVI breaks the -0.1 (-0.3) level, we can expect a bearish trend to occur.
To set take profits and decide whether you should trade with the trend, you need to analyze the nearest support and resistance levels.
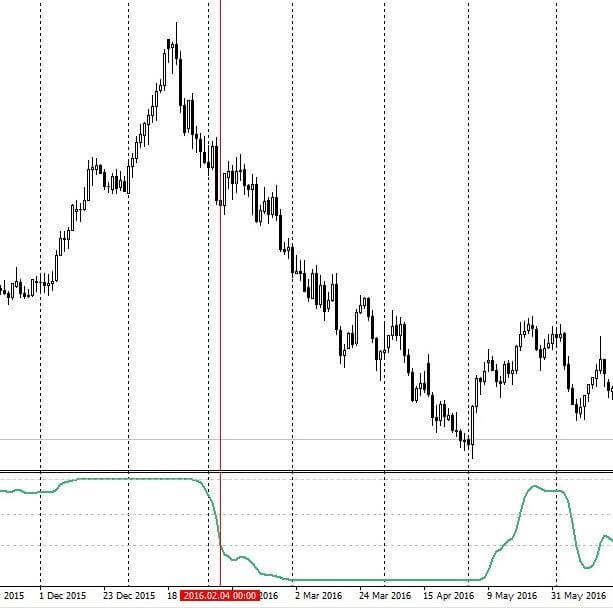
The -0.3 level crossing signals a new downtrend. The price went down by about 1,200 pips in total.
If, after crossing the levels, RAVI heads to the upper/lower boundary and then lingers in a bullish/bearish zone, this means that sellers/buyers are still strong and push the price to higher highs/lower lows.
Trend continuation
If, while being in a bullish/bearish zone, RAVI heads to zero but then resumes to move with the trend, this means that the trend is still alive, and you can open another position in the direction of the current trend.
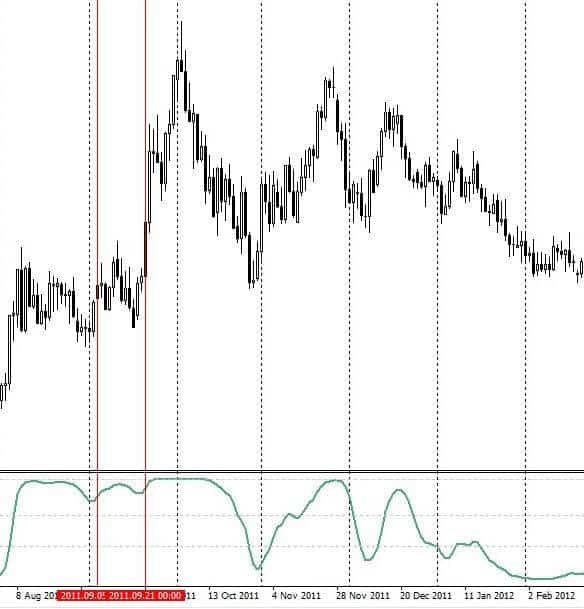
Two uptrend continuation signals after minor corrections.
Trend ending
If RAVI returns to the trading range, the current trend has come to an end. You need to close your existing positions and watch how the situation will play out.
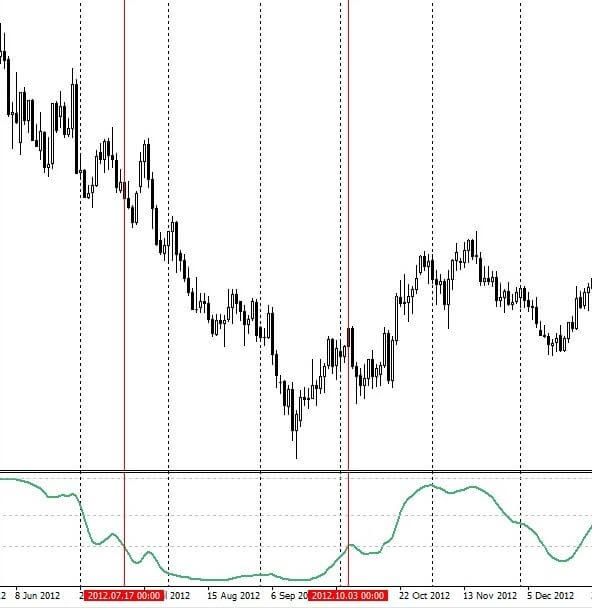
Daily chart. The horizontal lines indicate where RAVI entered and left the bearish zone. If a trader used this signal for entry, they would earn more than 250 pips.
Flat filtration
If RAVI moves between the key levels without crossing them, there is no strong trend in the market. If you trade with the trend, you should be patient and wait. If you prefer trading in flat markets, you might want to use oscillators and channel indicators (TMA, Keltner channels) to trade near the boundaries of the range.
Daily chart. RAVI identifies a flat range. Range traders might consider opening pullback trades using Keltner channels.
RAVI works well with other technical indicators. You can successfully use it as a reliable filter as a part of both trend and range trading strategies.
RAVI modifications
RAVI has one pretty popular modification. In the modified indicator, a signal line is replaced with a histogram, which makes RAVI look like MACD. Now you need to monitor histogram bars instead of a line. However, the signals generated by the indicator remain the same.
For some traders, RAVI in the form of a histogram is more visually appealing. However, this is the question of personal preference.
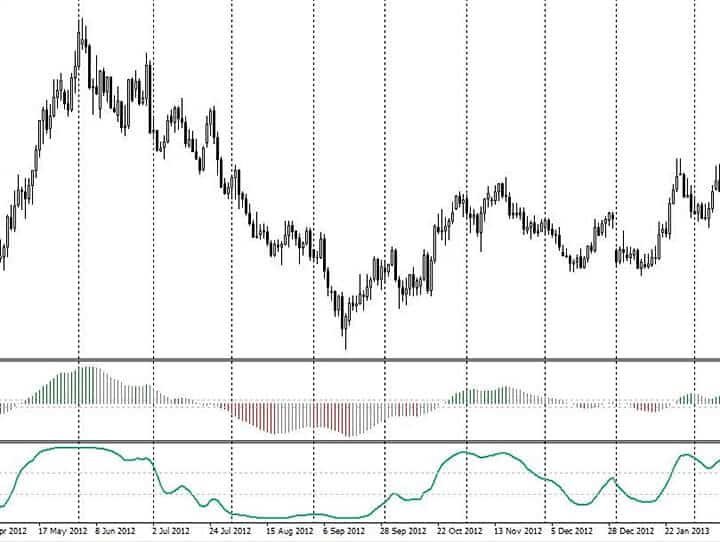
Daily chart. Linear RAVI vs. Histogram RAVI.
RAVI: Cons and pros
Thanks to a smart calculation method that incorporates quarterly and weekly tendencies, RAVI is good at detecting trends and eliminating flat movements. While the indicator was originally designed for daily chats, you can try to adjust it for hourly charts by using the following parameters for slow MA and fast MA: 72 and 12 (3 days and half of a day) or 120 and 24 (5 days and 1 day).
When it comes to shortcomings, RAVI has a few. First, it slightly lags. Second, you can’t be sure that RAVI will work as well on lower timeframes. Remember that Chande developed RAVI for daily charts, so it’s only natural that it works best on a daily timeframe.
Wrapping it up
It’s safe to say that RAVI is a great trading tool worth exploring. You can use it as a filter in your daily trading strategy. Before applying this indicator in real-life trading, you should test it on historical data and see what markets and currency pairs it fits best.


In a world full of indicators, why would I trust one indicator called Ravi, if the indicators were working, then the world could have settled on a single signal, but the many indicators show they simply don’t work
I keep following coach
Some people here are directing a lot of negative energy, anyway Coach keep doing the good job you have been doing, don’t focus on the negatives
Well done admin
Can I use this indicator on other platforms?
Thanks for your valuable insight. Eagerly waiting for more of your tutorials
Thank you for empowering my trades
I wish we would have a face to face class coach