Symphonies is an intraday system that will be useful to both novice and professional traders.
The system relies on the following principles:
- trend; (by the way, check the article about the Dow Theory to learn what the trend is)
- emotion;
- sentiment;
- extreme points.
When put together, these principles create a balanced system, smooth like a Symphonie. While each element produces a weak sound, together they create beautiful music. This is how the strategy got its unusual name.
After years of testing different indicators and strategies, a trader under the nickname Evaluator decided to develop his trading tool. The system was first published on the Forex Factory forum.
Symphonie was tested over 20 weeks. The results were fascinating. The problem with many trading strategies is that they only look good “on paper” and turn out to be useless in real life. The Symphonie’s inventor managed to prove that his tool works and delivers good results in real-life trading conditions.
How to use the Symphonie strategy
- Currency pairs: Any (although the Symphonie’s author only trades EUR/USD).
- Trading period: 5-minute chart (you can use other intervals too)
- Trading sessions: European, American.
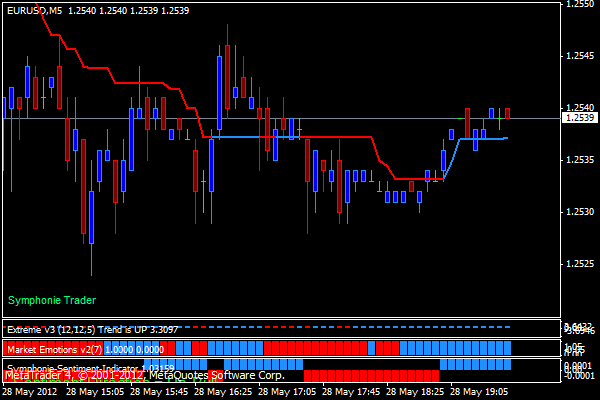
Indicators: Below you can download 4 indicators (one for each principle) and a template. Add the indicators to the “experts” directory on MetaTrader. Add the template to the “templates” directory. Install the template in MT. Your chart should look like this:

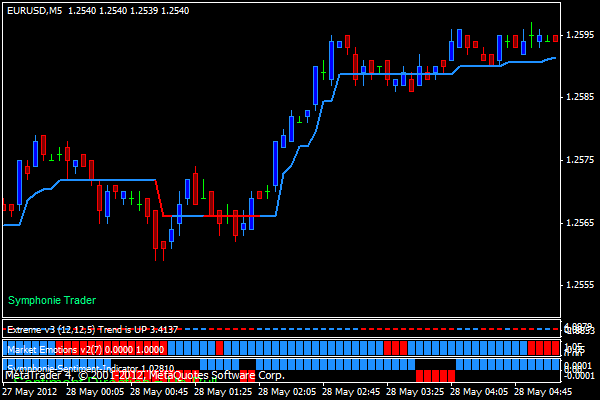
On the chart, you can see 4 indicators: Trend, Extreme, Emotion, and Sentiment. Blue bars indicate a buy signal. Red bars indicate a sell signal.
Entry
Go short: All indicators move down and all bars are red.
Go long: All indicators move up and all bars are blue.
Here is an example of a short trade:

Here is an example of a long trade:

Make an entry after the signal bar has closed. The strategy aims to filter minor price fluctuations and allow the trader to trade with the main trend.
Stop-loss: The author recommends using a stop loss of up to 50 points. However, if the Extreme indicator changes its color, don’t wait till your stop-loss is activated and exit the market right after the bar has closed. If you’re a risk-loving trader, you can wait for the Trend indicator to change its color and then close the trade. The most reckless option is to wait until all 4 indicators change their color.
We don’t place a take profit because we’re using the exit rules described above.
At 30 points, we move our stop loss to breakeven. The author recommends adding 3 more points. If the trade is closed at breakeven, we at least make 3 points.
You can identify trends on higher timeframes and use a 5-minute chart to open trades in the direction of the main trend.


An advanced strategy…. Good thing about reading from the best
My hero….. You never dissapoint…. Firing shots. Excellent content, delivery and skills
When is this strategy likely to fail me?
I have tried this for the past one week and it is bearing fruits…. I was losing atleast am now at break even
Sharp and direct to the point as always
Great strategy
I disagree…. The indicator obviously lags and hardly says anything we don’t already know
Thanks coach