

In technical analysis, the Wolfe Waves is a natural trading pattern, which is typical for almost any type and condition of the market. The pattern consists of five tribes, which reflect the aiming of demand and supply to achieve an equilibrium state. The pattern can be formed in both the short-term and the long-term period, from the minute timeframes to the weekly ones. The Wolfe Waves can help determine the moment of the current trend reversal, the further price movement direction and the time when it will reach the desired position.
Before reading the article and writing your questions in the comments section, I recommend to watch this video. It’s not long but covers the biggest part of questions on the topic.
Many Internet infopreneurs are trying to sell the budding traders some indicators that help to determine the Wolfe Waves on the chart. Is there any use from these indicators? Or maybe the old good “manual” method would be better?
RULES OF THE BULL PATTERN FORMATION:
- Point #1 – the first of three points of the pattern.
- Wave #1-2 – the basis of the pattern. The whole pattern is the continuation of this basis.
- Point #2 – the first peek of the oscillative price movement. It has to be higher than the point #1.
- Point #3 – the second of three points of the pattern. It is the minima, which is reached after the 1-2 wave. It has to be lower than the point #1.
- Wave 3-4 – the second wave of the pattern.
- Point #4 – the maxima of the second wave of the pattern. It has to be lower than the second point and higher than the third one.
- Point #5 – the third point of the pattern. It is the minima, which is reached after the 3-4 wave. It is placed on the line drawn from point #1 to point #3. This is the entry point. When this point is reached, the pattern is considered good enough to start trading.
- Points #1-3-5 – on the same line.
- Point #6 – the goal. It is located on the line drawn from point #1 to point #4. Once the point #6 is reached, all the positions should be closed and the pattern is considered completed.
- Wave 5-6 is the strongest one and the only one good enough to trade Wolfe waves.
- Points #1-4-6 are on the same line.

RULES OF THE BEAR PATTERN FORMATION:
- Point #1 – the first of three points of the pattern.
- Wave #1-2 – the basis of the pattern. The whole pattern is the continuation of this basis.
- Point #2 – the first peek of the oscillative price movement. It has to be lower than the point #1.
- Point #3 – the second of three points of the pattern. It is the maxima, which is reached after the 1-2 wave. It has to be higher than the point #1;
- Wave 3-4 – the second wave of the pattern.
- Point #4 – the minima of the second wave of the pattern. It has to be higher than the second point and lower than the third one.
- Point #5 – the third point of the pattern. It is the maxima, which is reached after the 3-4 wave. It is placed on the line drawn from point #1 to point #3. This is the entry point. When this point is reached, the pattern is considered good enough to start trading.
- Points #1-3-5 – on the same line.
- Point #6 – the goal. It is located on the line drawn from point #1 to point #4. Once the point #6 is reached, all the positions should be closed and the pattern is considered completed.
- Wave 5-6 is the strongest one and the only one good enough to trade Wolfe waves.
- Points #1-4-6 are on the same line.
If you want to figure out the most popular tools of finding the Wolfe Waves, let’s take a look at the three most popular tools among the traders.
Table of Contents
THE WOLF WAVE FINDER INDICATOR
The indicator has a very simple principle. The Wolfe Waves are created around the Zig-Zag extremes. The indicator starts its work from the first top (or low) after the previous waves are done. Also, the indicator marks the key points of the pattern with the digits and draws two lines (the breakout line and the target line).
On the one hand, the idea of using Zig-Zag as the basis looks reasonable enough since it greatly simplifies the development process. All we have to do is to determine whether the price extremes correspond to the rules for the Wolfe Waves formation. Unfortunately, this approach does not prove to be the best in practice. The thing is that the patterns defined by the indicator are too dependent on the Zig-Zag settings.
You will have to spend a lot of time customizing the settings until the indicator will work well.
That’s not the only problem with this indicator. The figures produced by the Wolf Wave Finder indicator are far from the idea of the Wolfe Waves. That is, you can see anything on the chart, except for the real Wolfe Waves. In particular, the indicator does not follow the periodicity of the tops and lows and the waves can be placed at any distance from each other. The points may be also placed in the wrong order relative to each other.
The indicator is good enough only for a schematic notation of the pattern.
However, it is an uneasy task to apply in real life. Despite the indicator has sense in it, it doesn’t fulfill the task. Probably the indicator will be helpful for those, who are just beginning to study this sphere and have not yet learned how to determine the key price extremes on their own.
Settings:
- ExtDepth – the value of the Zig-Zag depth.
- ExtDeviation – the value of the Zig-Zag deviation.
- ExtBackstep – the value of the Zig-Zag Backstep.
- ExtNumbersColor – the color of the marks on the chart.
THE PZ WOLFE WAVES INDICATOR
When you launch the indicator for the first time, you will see its main problem. The indicator creates a dense veil of multicolored lines and the Wolfe Waves are taking all the visible space. If you are lucky, you will see a price chart from time to time but it will be hidden from you most of the time.
Visualization itself is not so bad though. The pattern is drawn with a thick blue line from the first or the zero point. The breakout line is drawn with a dot-dash line and the target line is drawn with the dotted line. Before the indicator receives the signal, it waits for a breakout in the direction of the wave and draws an arrow corresponding to the direction and color on the chart. By the way, the lines are cut off while crossing the price and that helps to avoid turning the chart into a web of rays.
If you use the indicator, be sure to turn on the StrictWaves option, which will reduce the number of false patterns. However, as you can see from the example, the chart is still mostly filled with some unrealistic figures, which have nothing to do with the real Wolfe Waves. At some parts, the point #4 goes beyond the maximum of the point #2, which creates goals impossible to achieve. You should ignore such results. As a result, the indicator produces something similar to the Wolfe Waves but they are not.

Settings
- SmallWave – the small wave size.
- MediumWave – the medium wave size.
- BigWave – the large wave size.
- StrictWaves – register of the zero pattern formation point (increases the quality of the signals and reduces their quantity).
- MaxHistoryBars – the number of the bars under analysis.
- DonchianFilter – register of the Donchian channels at breakout;
- DonchianPeriod – the indicator period
- AlertCaption – the alert heading.
- DisplayAlerts – the option to turn on notifications about new signals.
- email alerts – the notification by email.
- SoundAlerts – the sound notifications.
- sound file – the sound of the notification.
THE WOLF WAVES FIND INDICATOR
Let’s talk about the most interesting indicator from the collection. The algorithm of this indicator allows you to adjust the wave size and maintain the proportionality of the figure, which is one of the most important characteristics of the pattern. When the price goes into the “sweet zone” (the yellow area on the chart), you will get a price tag (a signal to open the position). The color of the tag depends on the presence or absence of the MACD divergence at the moment the signal appears. The red color (the WolfBeerColor parameter) shows that there is a divergence, and the blue color means that is no divergence (WolfBullColor).
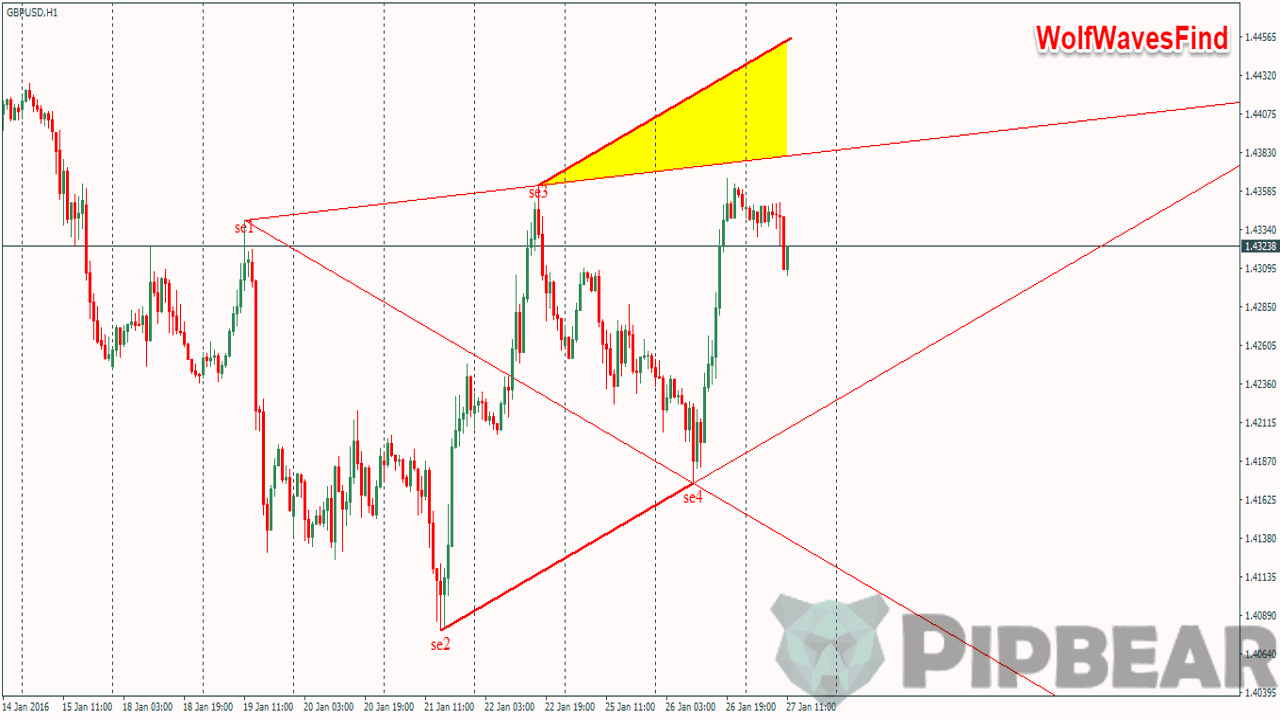
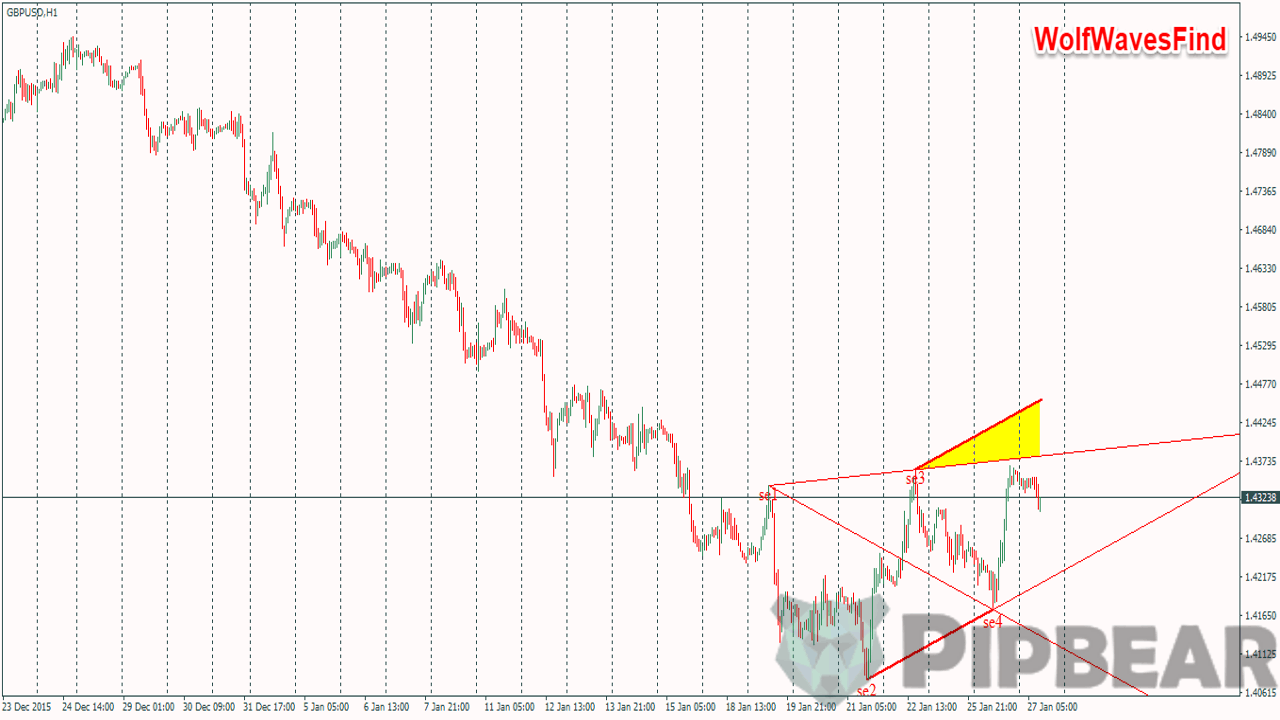
At the same time, the indicator does not take into account the previous trend and as a result, we can get a trend continuation pattern instead of the reversal pattern:
You should say that this indicator has a few peculiarities comparing to the analogs:
- If you set TRUE value to the OpenWindows_5Point parameter, the chart window will appear on the foreground when an entry signal appears. This function requires the use of DLL.
- The indicator analyzes the MACD divergence and evaluates the signal strength independence of presence or absence of differences by the oscillator.
- The indicator displays the so-called “sweet zone” (an entry point) with yellow color.
This indicator shows the closest results to the real use cases and it can be applied as an auxiliary tool for chart analysis. The indicator will help you to find the hidden patterns even if you are a professional wave trader.
Settings
- nPeriod – the maximum peak size (trough) in bars.
- find – the minimum peak size (trough) in bars.
- Limit – the pattern search area on the chart;
- LabelPoint – the tag offset in points.
- LabelShow – show the tags.
- OpenWindows_5Point – activate the chart when the pattern is found.
- OnlyDiver – the alerts are allowed to go only when there is a divergence.
- MACDFastEMA – the fast MACD moving average.
- MACDSlowEMA – the slow MACD moving average;
- MACDSignalSMA – the signal MACD moving average.
CONCLUSION
Each of these indicators helps to find the Wolfe Waves to some extent but none of them can do it in full. Even if you leave aside subjectivism, there are still a lot of factors that affect the figure. You can rarely find an ideal figure on the real market, which is why the traders’ goals are often too ambitious. The traders often set additional goals by drawing lines along the neighboring extremes or set the trailing stop orders to solve this problem. However, despite none of these indicators can be used independently, each development provides a unique idea, which may help to learn how to determine the Wolfe waves on your own.


Are these patterns not the same as rising wadge and falling wedge???
wow….I have always been intrigued by this and I never succeeded using it. I think this time I have a chance of doing it right under your guidance
Maybe the most ubiquitous pattern in the daily time frame and the most I have in my archive,
Very similar to an elliott ending diagonal
How do we set out stop in a wolf wave trading strategy? And how do we evaluate the risk/reward ratio? Many thanks!
Awesome job…. Well put, many thanks
I think it would be better if you told us the best trading method out of all the methods
Do you have a specific method of trading?