

It’s safe to say that candlestick patterns are well-known to every trader. Even if you don’t use candlestick analysis in your trading, you must have a general idea of how you can recognize candles on a chart and benefit from them. Most traders are terrified by the idea of having to memorize all formations to be able to immediately detect them on a chart.
Before reading the article and writing your questions in the comments section, I recommend to watch this video. It’s not long but covers the biggest part of questions on the topic.
The good news is that you only need to memorize a few candlestick formations which are considered to be the most reliable ones. This will boost your chances to correctly identify entry points. In this article, we’ll introduce you to a Doji pattern.
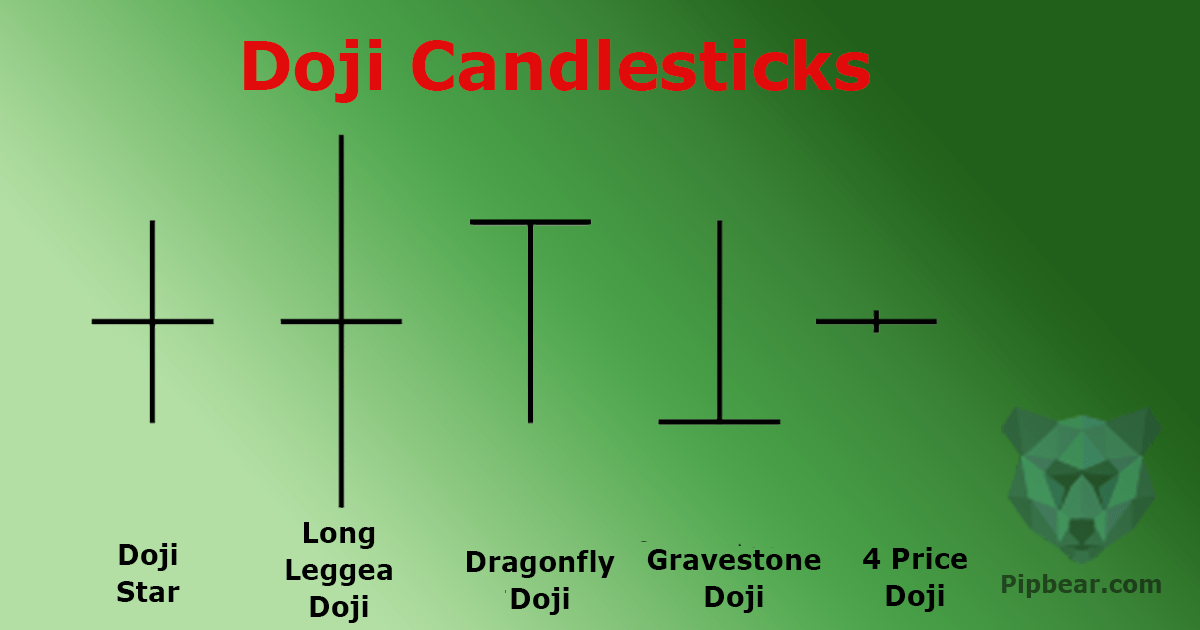
Table of Contents
How to recognize and interpret a Doji pattern
To overlook a Doji pattern on a chart, you must be blind. A candle stands out through its peculiar structure. It had nobody and its opening and closing prices are equal. A Doji with a body (even a short one) is considered to be an imperfect pattern.
Plus, a Doji candle usually has two long wicks (tails). By looking at a candle’s body (if it has one) and its wicks, you can easily tell what’s going on in the market.
If a Doji candle has no body, there is a balance between the bears and bulls. A small body indicates that the market has been taken over by either bulls, or bears. Because the body is too short, we can’t talk about a strong domination yet. This is when you need to take a look at the wicks.
- Medium or long wicks are indications of significant price fluctuations. Short wicks signal that a price is moving within a narrow range.
- Same-size wicks indicate a bears-bulls power balance.
- If you see wicks of different sizes, there was a failed attempt to push a price in the direction of the long wick.
How to trade a Doji pattern
If you see a Doji pattern on a chart, be sure not to ignore it. While it doesn’t provide much information on its own, it can be successfully paired with other candles or price levels. This is when a pattern turns into a powerful trading tool. If a Doji pattern occurs among candles with short bodies, it means that the bulls and bears are currently balanced.
If a Doji followed a candle with a long body, you should lookout for a possible reversal after a continuous trend. If a Doji forms at the top or bottom of a trend, you need to open a trade against the trend provided at least one of the following conditions is met:
- A candle following a Doji has a long body and formed against the trend.
- There is a gap between candles in the direction of a reversal.
- The closing price of a candle following a Doji is lower/higher than the opening price of a candle preceding a candle.
Each of these conditions act as confirmation of a trend reversal.
Dragonfly and Gravestone Doji patterns
As mentioned earlier, an ideal Doji pattern lacks a body and has wicks on both sides. However, if the pattern fails to fit this description, it can still be useful to a trader. Let’s take a closer look at the Gravestone and Dragonfly Doji patterns.

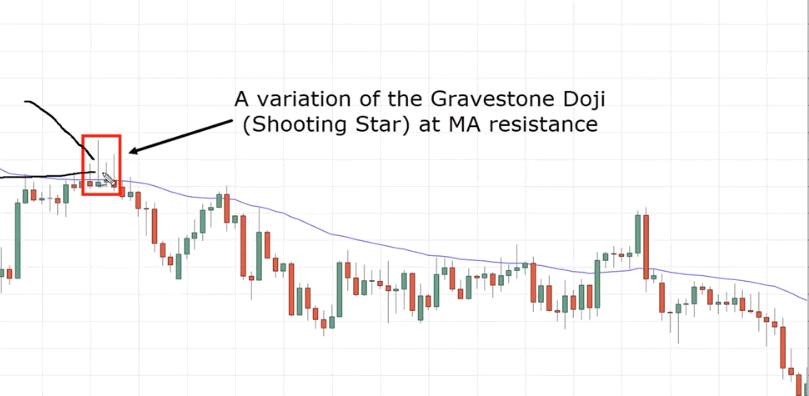
A Gravestone pattern features a Doji candle that lacks a lower wick. Its Open, Close and Low prices are equal. If a Gravestone pattern occurs within a continuous uptrend, it indicates a resistance level and possible trend reversal. You need to wait for confirmation in the form of a long bearish candle (it can be red or black, depending on the platforms you’re using).
A Dragonfly pattern is a Doji candle without an upper wick. Its Open, Close, and High prices are equal. If a Dragonfly follows a continuous downtrend, it may indicate a support level and upcoming trend reversal. Like with the Gravestone pattern, here you also need to wait for a confirmation signal.
How to use a Doji pattern in trading
Traders use a Doji formation to detect trend reversals. If you see a Doji on a chart, you need to open a trade against the current trend.
Here are the conditions for opening a long position:
- There is a stable downtrend.
- A Doji is preceded by a bearish candle with a long body.
- A Doji is followed by a bullish candle with a long body.
Forex traders are recommended to set a stop loss below the low of a Doji candle. As for a take profit, you should place it at the nearest price level. The opposite rules apply for opening a short position.
Using Doji patterns to trade binary options is just as easy. You simply need to recognize a Doji pattern, check the confirmation signals, and open a position. The expiry time of your binary option must equal to 2-4 candle lengths. For example, if you’re trading a 5M chart, your binary option contract must expire in 10-20 minutes.


