

Traders use technical and candlestick patterns both as standalone tools and a part of trading strategies. This article looks at two popular reversal candlestick patterns, Hammer and Hanging Man.
Before reading the article and writing your questions in the comments section, I recommend to watch this video. It’s not long but covers the biggest part of questions on the topic.
General information
Both Hammer and Hanging Man are one-candle formations. They’re characterized by long lower wicks (shadows) and short real bodies. The patterns tend to occur at the top of a day trading range or very close to it.
Hammer is a hammer-shaped candlestick that forms at the bottom of a downtrend. Its Japanese name is Tonkachi or Kanazuchi. This pattern occurs when the price of an asset has been dropping.
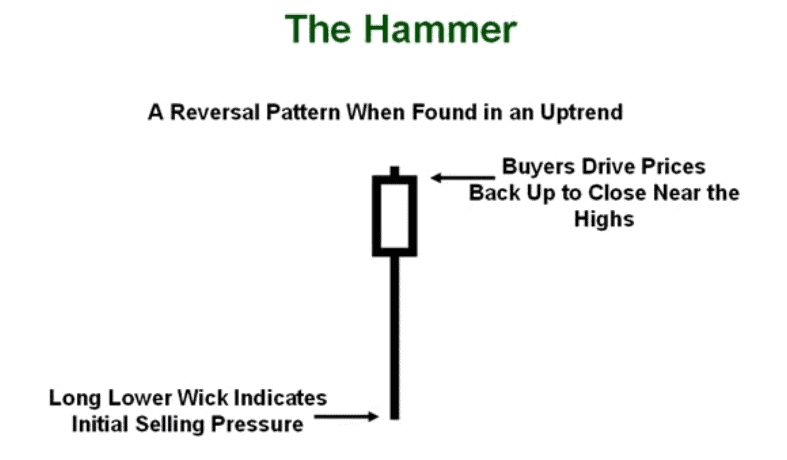
Hammer reversal pattern (Kanazuchi/Tonkachi)
Hanging Man forms at the top of an uptrend and represents a possible reversal. It features a long lower wick, small (if any) upper wick, and short real body. The Japanese name of this formation is Kubitsuri.
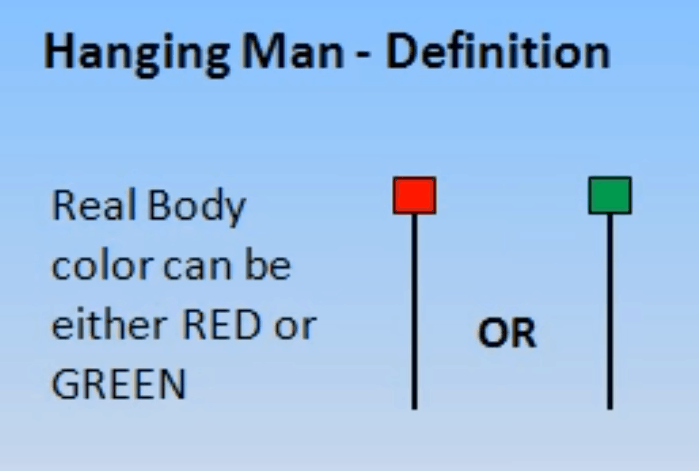
Hanging Man variations:

The patterns occur when the following conditions are met:
- The candle with a short body forms near the upper boundary of a trading range. Note that the color of a candle doesn’t matter.
- The lower wick of the candle is 2-3 times longer than its real body.
- The candle has little to no upper wick.
Traders’ psychology behind the patterns
- Hammer
A Hammer pattern forms in a market dominated by the bears. A trading session opens with a price plunge. Then a price goes up and hits the day’s high or at least comes close to it.
Since a price is reluctant to dive deeper, selling power starts to fade away. Most traders with open bearish positions feel insecure. If the closing price is higher than the opening price (the candle is white), it means that things are looking good for buyers. As a result, the next trading day starts with higher opening and closing prices.
- Hanging Man
A Hanging Man formation is found in a bullish market. For this pattern to occur, a price needs to drop lower than the opening price of a trading session and then raise to a high. A long lower wick in the Hanging Man candle shows how low a price can sink.
The bearish nature of a Hanging Man pattern is confirmed by the following candle with a lower opening price. If a candle following a Hanging Man opens at a lower level, traders might want to consider selling opportunities.
More about Hammer and Hanging Man patterns
Listed below are the signs that strengthen the signals generated by Hammer and Hanging Man formations:
- extremely long lower wick;
- short upper wick (or no upper wick at all);
- very short real body;
- strong trend and the color of a body.
The color of a candle can tell a lot about how strong a pattern is. For example, a Hanging Man with a black body implies a stronger bearish sentiment than its white counterpart. In the same way, a Hammer with a white body displays more bullish power than the same pattern with a black body.
The lower wick must be at least twice as long as the real body but no more than three times. The length of an upper wick must be 5-10% of the candle range (high-low distance). The bottom of a Hammer pattern must be below the trend. As for a Hanging Man, its bottom must be above the trend.
Case Study
Hammer pattern on price chart:
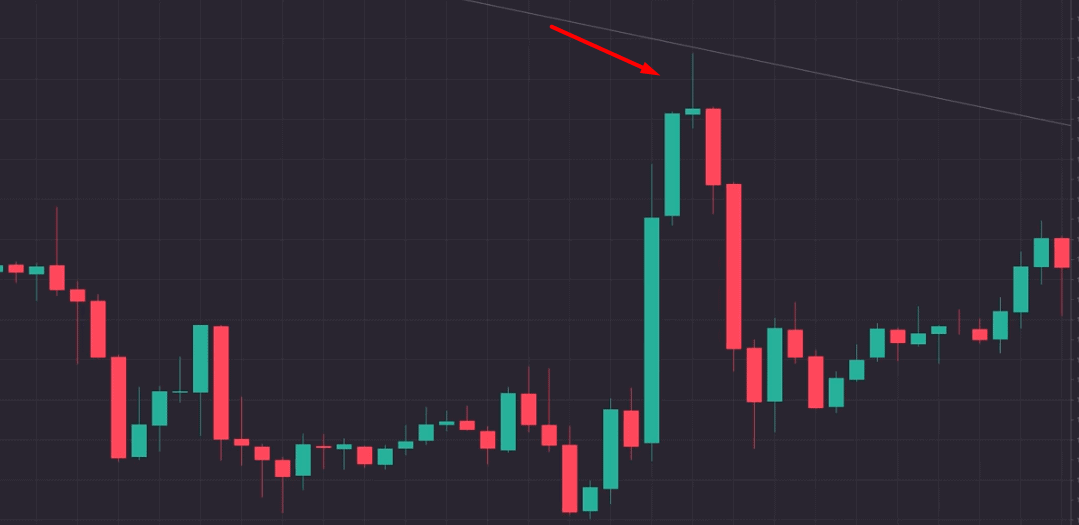
Hanging Man on a price chart:

Take a look at the charts to see how the two patterns work. Following the formation of Hammer and Hanging Man, the trends hit a bottom and a high, respectively, and changed their direction. On the second chart, the Hanging Man pattern has a flawless structure, with no upper wick and a good body/lower wick ratio. The following trading day closed with a bearish candle, which was a solid confirmation of the Hanging Man pattern.
On the first chart, the Hammer pattern has a less than ideal structure. It has a tiny upper wick. I chose that kind of pattern deliberately to show you that Hammers come in a variety of forms. It’s not uncommon that a Hammer candle has an upper shadow reaching up to 10% of the candle range. As you can see from the chart, the pattern played out nicely, and the trend made a reversal.


