

Whether you have ever opened a trade based on ascending, descending or symmetrical triangles and lost money due to a trend reversal?
We will see below how often the triangle model does not work and we will try to understand the reasons for the false trade signals emergence.
Before reading the article and writing your questions in the comments section, I recommend to watch this video. It’s not long but covers the biggest part of questions on the topic.
Graphic models are like children: some behave better while others – worse.
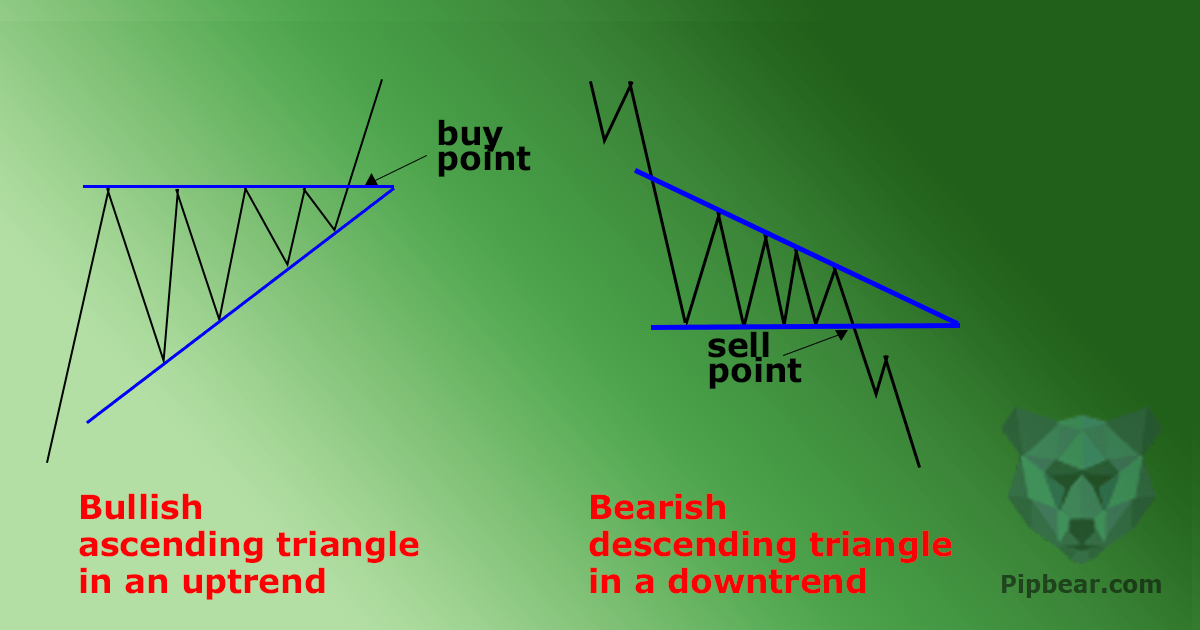
Triangles are ascending, descending and symmetrical, rather attractive for trade because their form can indicate a breakdown direction. But it’s not easy to trade them successfully. Let’s look at them in order. Let’s start with the ascending triangles.
Table of Contents
Ascending triangles

Figure 1 shows an example of an ascending triangle (indicated in blue) on the daily timeframe. The price hits the resistance level and bounces several times while forming a flat upper part. The line drawn through the vertices is approximately horizontal.
The cavities are increasing at the same time. This means the trend line, which connects the valleys, has an upward slope. Local vertices touch the upper line several times, while local vertices touch the upper line It is necessary to look for the price concerned each trend line at least twice and it is better – 3 times and more. Two trend lines intersect at the apex of the triangle.
The price must cross its area for all triangles while bouncing from the upper boundary to the bottom and filling its free space. Do not think the rounding trend reversal behind is the triangle. The left upper insert in Figure 1 shows such an error example. It’s a common mistake to take a part of the rounding reversal (black denotes the price line) and to represent it as an ascending or descending triangle (for convex reversals).
With an ascending triangle, the volume, as a rule, is decreasing (blue line). It can be quite low 1-2 days before the triangle breakdown. But sometimes the situation can change, for example, in this case.
The traders like that the inclined trend line indicates the breakdown direction – up (theoretically) in ascending triangles.
Prices are like a sprinter at a low start, which is collected with forces while waiting for the starting pistol shot and then powerfully rushes forward, often even more enthusiastically than in the figure shown. The breakdown occurs in 64% of cases according to the latest studies conducted on this model.
Look at the blue insert in the lower right part of the Figure 1. Can you define the ascending triangle model on this fragment? You need a trained eye to notice the triangles. However, this applies to any price model. When you know what you need to look for, and practice in finding triangles, searching for them becomes easy.
Are there any difficulties in trading ascending triangles?
What issues arise with the ascending triangles? The biggest concern when trading ascending triangles is to look away for possible false breakouts. As can be seen in Figure 2, the price touches several times supporting trend line while bounces off of a flat upper line i.e. triangle resistance. The triangle gets broken, as expected, however, there is no strong follow up to the upside and soon after the bears regain back control and push the price below previous triangle resistance and eventually go all the way to triangle support. Many traders were caught getting long above triangle resistance. This is a characteristic of choppy markets. The best way to protect against this scenario is to place your stop loss just below the breakout point.

The lack of a stable trend, most likely, would throw you out of position at a loss if trading this model. How often do such failed ascending triangles occur? For breakdown, the failed model is the one in which the price falls below 10% before turning and closing above the highest peak of this graphic model. In the case of a breakout, the price rises less than 10% before turning around and while crossing the entire triangle, close below its bottom (at the lowest price in this model).
My sample of 925 ascending triangles in a bullish market showed a failure in 26% of cases for breakouts. The breakdowns results were worse. I examined 463 rising triangles and the graphic model did not work in 40% of cases.
Descending triangles
A descending triangle is a bearish chart pattern that is created by connecting with a trend line series of lower highs while the flat horizontal line connects a series of lows. Figure 3 shows a perfect descending triangle example. The price breaks and closes below horizontal support revisits (previous) support that acts as a resistance now before rotating back lower to create a new low.

You get a descending triangle model while turning an upward triangle. Let’s consider Figure 4. The descending triangle has a flat bottom part since the price bounces from this support line several times. The upper trend line has a downward slope, which implies a breakdown and weakening of the bullish positions. Breakdown is the most likely, but not guaranteed scenario.

This downward triangle breaks down. But the price doesn’t fall far, unfolds and while rising above the upper triangle boundary above the highest price in this triangle. It was a failed attempt to breakdown.
Symmetrical triangles
The asymmetrical triangle pattern represents a formation where consolidation of price action happens before the price creates either a breakdown or a breakout. The pattern (shown below in Figure 5) is also known as a wedge chart pattern.

The price fluctuates between two converging trend lines in the case of a symmetrical triangle. It touches each of the lines at least twice, and better – 3 times or more while forming this graphic model. This model is sometimes called a spiral since the price is tightened up more and more until it breaks out from one side or the other.
Such symmetrical triangles unite the worst features of ascending and descending triangles. Failed breakdowns occur most often in 42% of cases from all studied graphic models, i.e. almost half of all transactions. The breakdowns also show the worst failure rate among all triangles – 27%.
Triangles’ trade efficiency statistics
Figure 6 shows the performance statistics for these three triangles types. Symmetrical triangles fail most often, both in breakout (27%) and down (42%). Descending triangles do not work less often than others.

Why is it important? If a symmetrical triangle breaks up in 27% of cases, it means the price, by definition, will rise by no less than 10% in 73% of cases. Although this sounds attractive, let’s compare it with another graphic model – the upside-down head and shoulders.
The breakdowns are unsuccessful for it in only 12% of cases. This means the price in 88% of cases rises not less than 10%. Perhaps you will want to switch from triangles to more reliable models, for example – head and shoulders. But triangles, nevertheless, can be successfully traded.
And that’s the way it can be done. Unsuccessful graphic models need to be learned through their trade and results analysis. You will manage to understand the ascending triangle quickly. Then switch to the descending triangles.
In this case, you can look for failed breakdowns (the price pushes the triangle down, unfolds and then closes above the highest price in the given graphic model) and enter the position after finding such situations. Moving up after a failed triangle can be powerful, even though the entry into the position is late (above the highest triangle price and not after closing above the upper trend line).
Let’s look at the right side of Figure 6 Here are the performance statistics. For failed breakdowns, the figures show the distance from the lowest price in this model to the lowest low before the price rises by at least 20% (trend change). You buy the stock a day when the price closes below the triangle, and you sell at the lowest low before the price turns around.
This is the perfect trade. Do not expect your transaction will show the same result since these figures take into account hundreds of ideal trades. It can be better or worse. These figures are shown for comparison only.
The right column, for breakdowns, demonstrates the average value of price growth after the triangle can be considered unsuccessful.
These figures are also averaged for several hundred ideal trades. They reflect the distance from the highest price in this model to the highest high, i.e. previously to the peak before the price fell by at least 20% (trend change).
The failed downward triangle model efficiency with a downward breakdown significantly exceeds two other triangles. That’s why they are worth trading.
The issue with the triangles is they often do not work in the initial breakdown direction. If this happens, it may be more profitable to open a trade in a new direction since earning is the most important in trade.


Exceptionally great tip!. Thanks a lot.
Simple explanation thanks.
The best trinagle explanation i ve ever seen
Hi. This is high precise drawn triangle i’ve ever seen. in other place, they did not drawn triangle precisely. Do you have another course for triangle? thank you so much
superb lecture…………………thanks a lot …………….i became fan of u.
the pattern is the last thing. Many other factors involved. Verdict…Keep off
Just a triangle now telling people to trade….. I don’t agree
Nice read
Will keep following for more