

Dragon pattern is a reversal model of technical analysis on Forex. It is a rare candlestick figure indicating the very beginning of a trend reversal.
Before reading the article and writing your questions in comments section, I recommend to watch this video. It’s not long, but covers biggest part of questions on the topic.
Dragon pattern is one of “exotic” reversal patterns in the Forex market and can be specified more exact as a variety of Double bottom pattern indicating the change of a bearish market to bullish. Accordingly, “Inverse Dragon” is formed at the end of the uptrend and beginning of the market decline. Reverse pattern signals are similar to signals of “Double peak” pattern formation signals.
SO HOW IS DRAGON PATTERN FORMED ON THE CHART?
Dragon pattern is formed in a falling market. Its formation starts with the Head (1). It is a local high from the ascending correction in a declining market. Once Dragon pattern head is formed, the market continues to decline, which leads to formation of two consecutive lows on the chart (approximately on the same level). These are the “Dragon’s feet“.
Local low from the first testing of the support line at the lower pattern boundary forms the “First foot of the Dragon” (2). The second foot is formed after re-testing the same support level (4). The difference between the lows of the First and Second feet be make from 5 to 10%.
There should be a peak between the Dragon’s feet or before the 2nd low (local high – correction of the downtrend), which is called the “Dragon’s hump”. “Foot – Hump – Foot” is essentially a reversal Double bottom pattern. The Hump height is located at the level of 38-50% of the Head height.
Finishing of Dragon pattern formation is proven by closing the price above the Dragon’s hump – the trend line (or resistance) drawn with points of its Head and Hump.
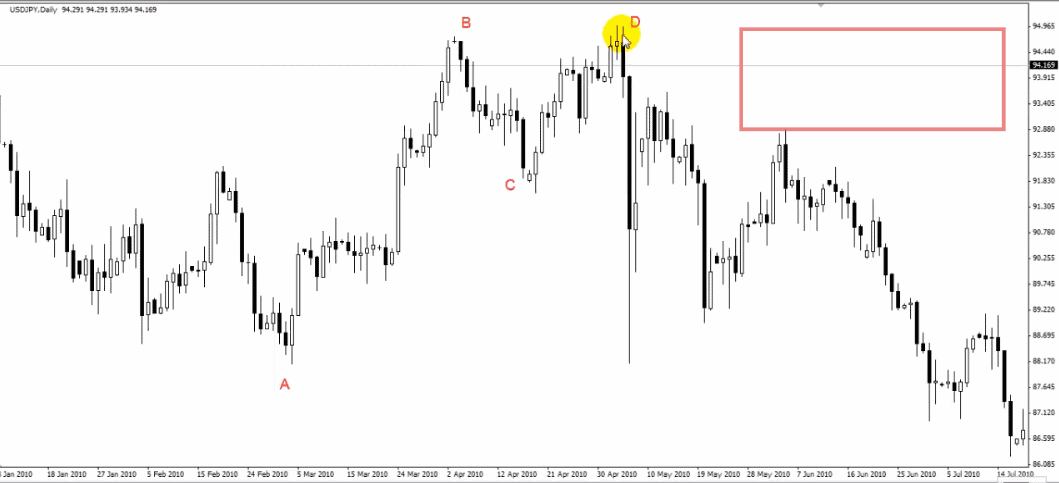
Formation of reverse Dragon pattern occurs according to the same rules, but in a growing market. Head and Hump are local lows, while Feet are highs as a result of testing the upper pattern limit. Pattern formation is finished after breakout of support line by the price and is drawn, similarly to the straight Dragon, from its Head to the Hump.
HOW TO TRADE WITH THE DRAGON PATTERN
When using Dragon pattern in the Forex market, the position should be opened after its formation, i.e. after the price breaks the trend line or the Hump pattern. To avoid entering the market on a false breakout it is better to wait for a candle or bar closing price to be above this line.
For the Dragon pattern in a downward trend, a breakout of the trend line price and closing of a Japanese candlestick above this line prompts a trader to open a long trade.
Thereupon, stop loss order should be placed a few pips (10-20) below the lower boundary of the Dragon pattern, i.e. below its Feet. Potential profit in pips corresponds to the Dragon Tail length, which is usually equal to the height from the trend line breakout point to the highest point of its Head. Simply put, the Tail distance is our future profits from the trade execution.
When trading with Dragon pattern it is advisable to enter the market with multiple positions simultaneously. In the beginning, a trader can set a more modest profit objective for the first trade, e.g. at the height of the Dragon’s Feet.
Take profit for the second position (2) can be set at the Head level. Once the first objective is reached, it is advisable to move the stop loss to the breakdown level. Then, once the price reached the middle of the Hump in Dragon pattern, a safety stop loss should be set at the Feet level. This allows the trader to minimize the risks and get the maximum possible profit from entering the position, even if the second objective won’t be reached.
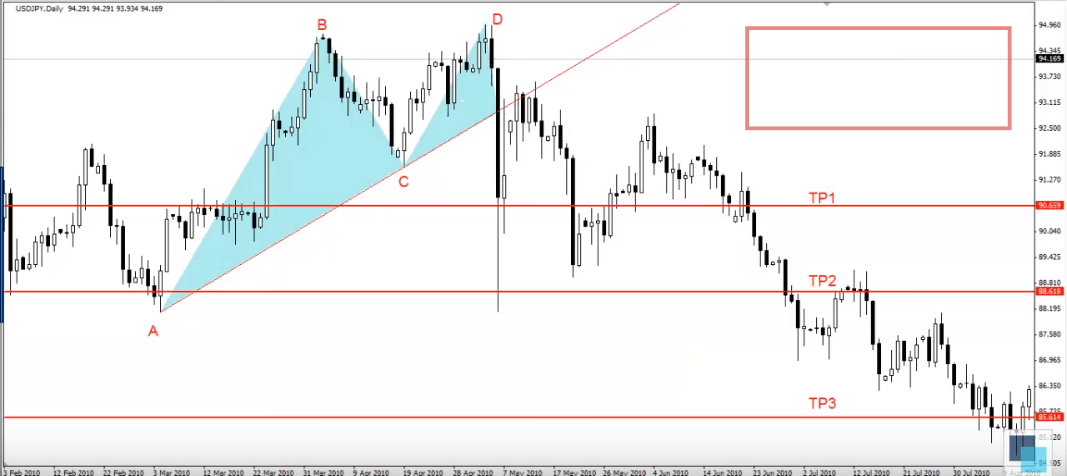
Alternatively, a trader can use Fibonacci levels to set the desired take profit values. To do this we apply Fibonacci grid on the Dragon pattern, starting from Feet to Head.
Thus, the trade profits can be set evenly on important Fibonacci levels. For example, as you can see on the picture, these levels are 38.2%, 50% and 100% for three levels, respectively.
The rules for opening and following the positions apply for reverse Dragon pattern in the uptrend too; the only difference consists in a short position. Example of this situation can be clearly seen in the figure below.
Alongside with the above stated, there are additional signals indicating authenticity of the trade signal by Dragon pattern; these can be:
- formation of reversal candle or bar;
- signals from oscillators (macd, rsi, stochastic, etc.) and possible divergence by indications of these oscillators;
- increase in Forex trade volumes.
Simultaneously change of the basic market direction is very rare to see. The trend reversal is usually followed by formation of several lows or highs in the same price range. Dragon pattern is based on the rules applied for determining these reversal points, which allows to open position at the very beginning of a new price trend.
And this allows a trader to trade with the optimal risk-return ratio. In addition, Dragon pattern is formed more often than “Double bottom” and “Double top” patterns which are similar to it. Moreover, it is formed in almost all time periods. Therefore, you can use it both for the long-term and short-term trade.
In the end, we’d like to add that the drawback of trading with Dragon pattern is a fact that these patterns are rather rare to see on the price charts. Therefore, effective trade with solely this pattern is almost impossible.
But it does not mean this pattern should be ignored in the trade process. On the contrary, you should use it by all means, because although such signals are rarely seen, they work very efficiently.


The best lecture on dragon I have seen ever since I started trading.
For anyone with experience is there anything more regarding chart patterns that you think I should learn? Also is there any topic covered that I should learn more about?
am still in the early stages of learning about the market and this really helped. How far back should my chart show so I can look for these trends? Is it better to view it based on a year? a week? I would really appreciate some advice on this. Thanks!
am still in the early stages of learning about the market and this really helped. How far back should my chart show so I can look for these trends? Is it better to view it based on a year? a week? I would really appreciate some advice on this. Thanks!
his is real forex education… not the get rich quick tricks sites… keep it up
Thank you for sharing.. Excellent tutorial!
Best Learning vpiece on patterns I have seen yet. Thank you.
Very helpful for beginners traders