

Long ago in one America far from here Ralph Elliott lived. He was budy analyzing the market on the long winter evenings and eventually developed the concept of the fractal nature of the market. Several generations of the traders have passed but his theory still finds its application in market analysis. We should say now that this theory works only on the trend markets and does not apply to the flat ones. It should also be noted that the market has changed significantly over the past 100 years and the Elliott theory doesn’t prove to be so right as it used to be but it can still be used by every trader even now. Moreover, some traders even create their trading strategies based on the Waves.
Before reading the article and writing your questions in the comments section, I recommend to watch this video. It’s not long but covers the biggest part of questions on the topic.
This article will be devoted to the postulates of the Wave Theory and its basis, and how to apply the theory in Forex trading.
Table of Contents
RALPH NELSON ELLIOT

Elliott found a distraction in studying the stock market behavior while overcoming the consequences of a serious sickness. He concentrated on the study of the charts on different periods trying to find a universal principle of the price behavior. He thought that would help one to predict the movement direction of the market quotations with high accuracy.
By the end of the 1920th, he managed to create a working version of the theory. It was the 5-wave pattern describing almost everything that happens on the market. Elliott noticed that the mass psychology was unified in general. He believed it was a consequence of the reaction to the external factors. Thus, you can describe the increasing and decreasing oscillations as some repetitive patterns. The wave pattern. At the same time, the author found out that the market itself had a fractal nature so the same pattern occurs at different time intervals. That is, we can infinitely split the existing wave moves into the smaller ones. In other words, each movement repeats itself on the different scales.
THE WAVE LEVELS

The classical theory contains 9 wave levels. Such marking helps to evaluate the scale of the underlying trend movement. The highest level waves are usually marked with the Roman numerals of the upper register while the simple numerals are used for the medium level waves, and the Roman numerals of the lower register indicate the waves of the lowest level. You won’t probably need that many levels in real life. Marking more than three wave levels is too difficult and not very useful for trading.
THE BASIC SEQUENCE
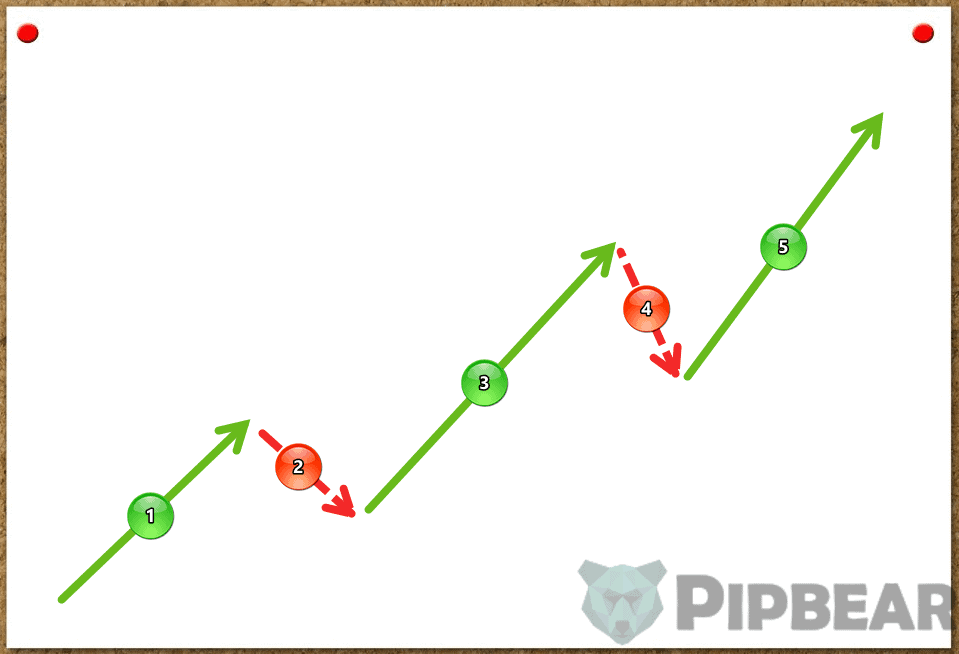
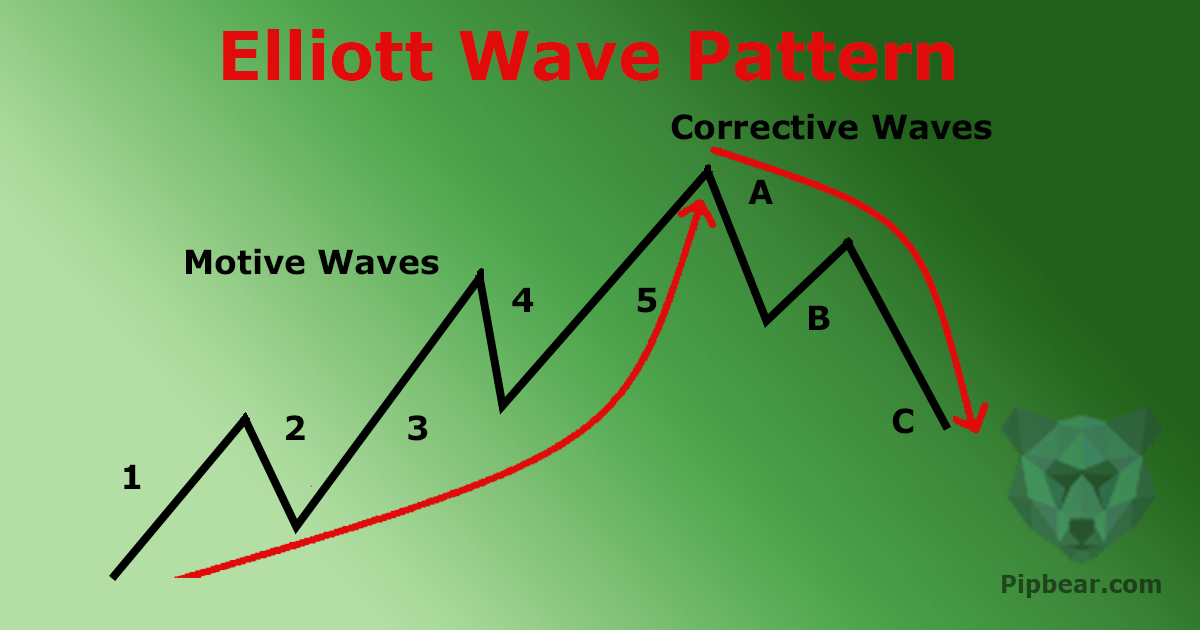
There are two types of waves, which are the impulse and retracement waves. The main direction of the pattern is determined by the impulse waves, while the retracement ones move in the opposite direction. In this case, the waves #1, #3 and #5 are the impulse ones since they determine the trend. Waves #2 and #4 are the retracement zones. This 5-wave sequence creates a higher-order impulse wave.
The retracement figure consists of three waves marked as A, B and C. In this case, the main impulse goes downwards, therefore the waves A and C are the impulse ones and the wave B is the retracement one. At a higher wave level, the sequence becomes a single retracement wave.

If you combine the 5-wave sequence with the 3-wave retracement figure, you will get a completed 8-wave cycle. That is, the complete cycle consists of two phases, which are the impulse and retracement. The cycle starts over after its completion.
You should always enter into the market at the beginning of a new cycle, that is, before the beginning of the first wave formation.
In any case, you must wait until at least one complete construction (the 8-wave sequence) is finally formed. Only after the trend is formed and the retracement A-B-C wave has begun, you can start looking for an entry point. The wave sequence can rebuild while forming so we don’t recommend you to enter into the market until the first cycle is completed.

You do need to understand that Elliott’s sequence is a fractal in its essence. That is, each wave is divided into smaller ones while keeping a common structure, which is a continuous change of impulse and retracement. Particularly, each impulse wave is split into a 5-wave sequence and each retracement wave is split into the 3-waves sequence.
According to the classical Elliot’s theory, the correct wave sequence must correspond to three characteristics:
- Wave #2 can never go beyond the wave #1. If this happens, the sequence must be recalculated by this rule.
- Wave #3 can never be the shortest one in the sequence. Usually, this is the line of the strongest impulse. Wave #3 should exceed the level of the wave #1. In this case, the waves #1 and #5 should be approximately equal in size.
- Wave #4 can never cross the wave #1. If it does, the sequence should be recalculated at once. The final cycle of the A-B-C wave retracement usually ends just in the area of the 4th
THE TOOLS
So let’s figure out what kind of tools you need. First of all, if you are a beginner and still have problems with determining the extremes on the chart, it would be good to have the ZigZag indicator at hand. However, it will only interfere in most cases since the indicator records strongly depend on the input parameters. We can say the same about any automatic Elliott Wave Marking tools. Therefore, I would advise you to mark out the extremes on the chart manually.

You can use any oscillator (for example, the RSI oscillator) to be sure about entering the market. You will also need the ATR indicator to calculate the Stop Loss order. Of course, you can use any other volatility indicator if you wish.
In general, any candlestick, bar charts or simple chart tools are enough for marking the waves. Many traders work using only a candlestick chart and some candlestick patterns. Do not forget that the Elliott Wave Theory is a creative process and the author only indicated the boundaries that should not be crossed.
Any version of Metatrader 5 and the TradingView service fit these requirements. The MetaTrader 5, for example, has a special semi-automatic tool for marking the impulse and retracement Elliott waves. However, in general, you can have the same result by the usual text tag.

EXAMPLES ON THE CHART
You should start marking with the 5-wave sequence. Take the moment of the current trend reversal as the starting point. The thing is to follow three basic rules of building the Elliott waves, which we have discussed earlier:
- The second wave can never be lower than the minimum of the first one.
- The third wave is usually the longest one in the sequence, and it can never be the shortest one.
- The fourth wave can never cross the maxima of the first one

So along with that, you get the first (impulse) wave of a higher level. This is very important since the simultaneous marking of several wave levels helps significantly in determining the entry point. The safest entry point comes after the full cycle is completed. That is the moment when the retracement wave is formed but the first wave hasn’t started yet. If we speak about the waves of a higher-order marked with red on the chart, then we can enter into the market after the second and fourth waves.
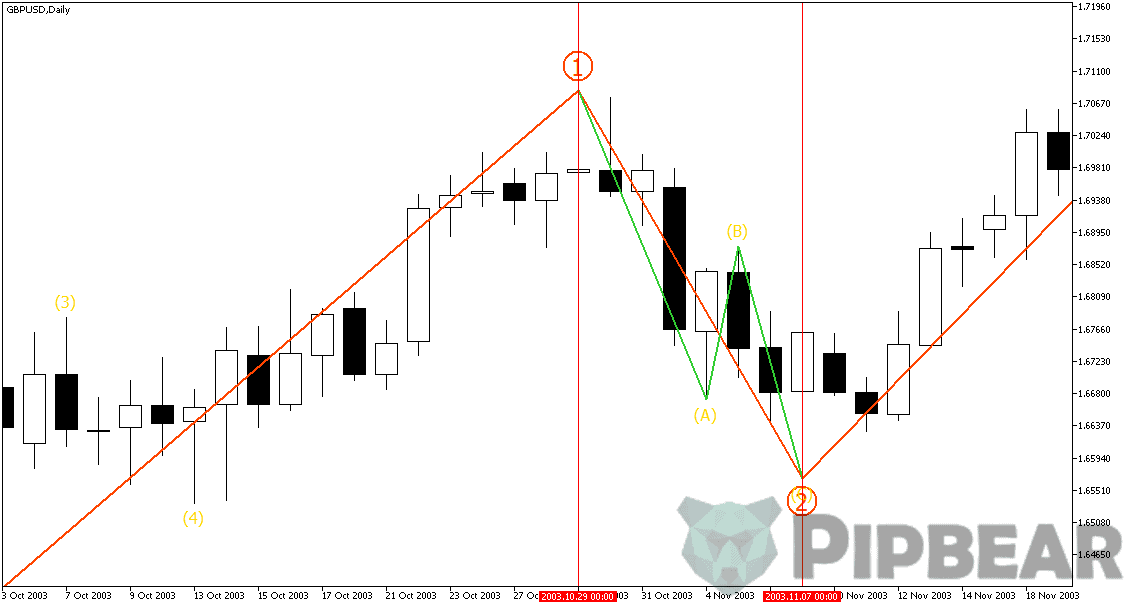
The easiest way to determine the completion of the retracement wave is to go to the lower timeframe. The retracement movement is almost identical to the harmonic pattern ABCD in its structure so you can apply the same construction rules while marking.
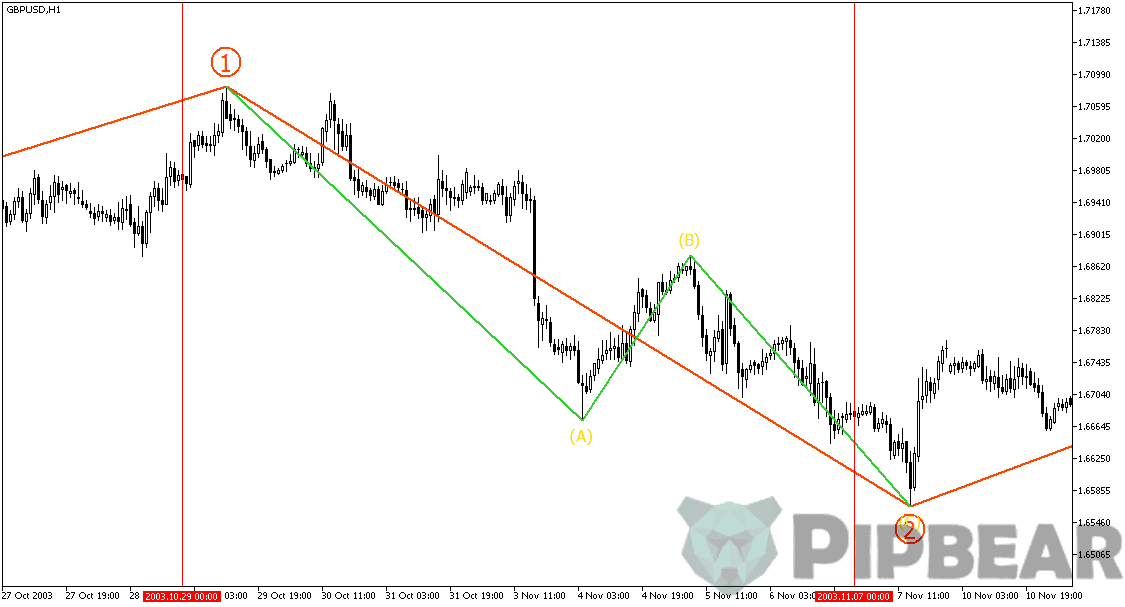
The harmonic pattern is symmetric in most cases and ends either at 127.2% or 161.8% of the Fibonacci expansion. In this case, the retracement happens to be more stretched. Therefore, you should stretch the grid from the wave B and wait for the price to reach 161.8%.
At this point, you can enter into the long transaction. The Stop Loss order will be equal to the triple ATR value. Since the third wave is just starting to form on a higher wave level, the Take Profit order should be quite large. Or you can set the Take Profit order 3 times larger than the Stop Loss order. The Trailing Stop order would be useful too.
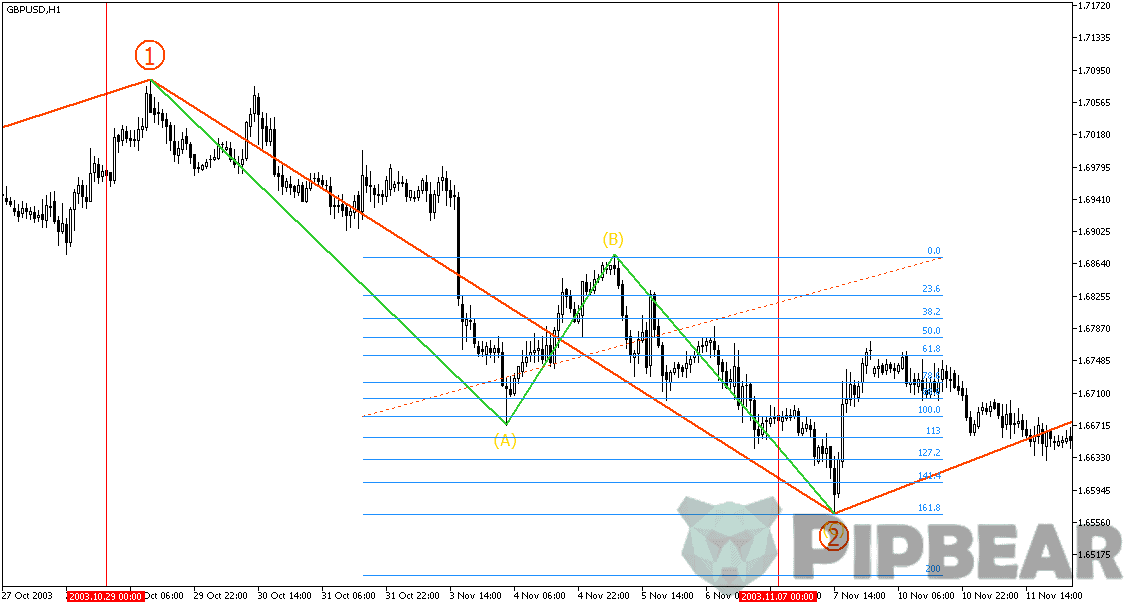
Therefore, if you need to determine the potential entry point, you should first measure the distance to the point #5 by stretching the retracement grid of the A-B wave. That’s how we have found out the required retracement level of 161.8%. The same principle can be applied for any wave level.

Figuring out the entry point is now just a mere formality. The point C will be at the distance of 161.8% from the A-B retracement wave.

Of course, one of the most important stages in determining the right place to set the Stop Loss order. You can use the triple value of the ATR indicator as a universal solution. Although in most cases, you just need to find the point, at which the current marking will lose its relevance. That is the right point to set the Stop Loss order.

We advise to close the position in parts. In this case, if you have opened long, you should wait for the formation of the next retracement wave. Once you identify it, you can close half of the position. Even if your forecast is wrong, you will still get a good profit. Set the Trailing Stop order for the rest of the position.
The similarity of the wave sequence allows us to make an accurate forecast of the price movement, which is based only on the data of the lower periods. Therefore, use at least two wave levels (three-level for the best) while marking.
To improve your marking skills, stick to the 1-wave level. A one-hour chart is good for training. However, if you are going to trade in the real market, you need to switch to the daily chart.
The main thing is to learn how to determine a continuous wave sequence on the graph when the end of a complete cycle determines the beginning of a new one. First, you should find the last major extremum. Roughly speaking, it is the maximum or minimum point of the whole chart.

After that, determine the first wave. This is quite simple since the first local maxima that are lower than the previous one. The third wave can never be less than the first one. There must be a powerful directional movement. When another maxima appear below the second wave minima on the chart, consider the fourth wave is formed. After the fifth wave, wait for the ABC wave retracement, which would also mean completion of the wave #5.

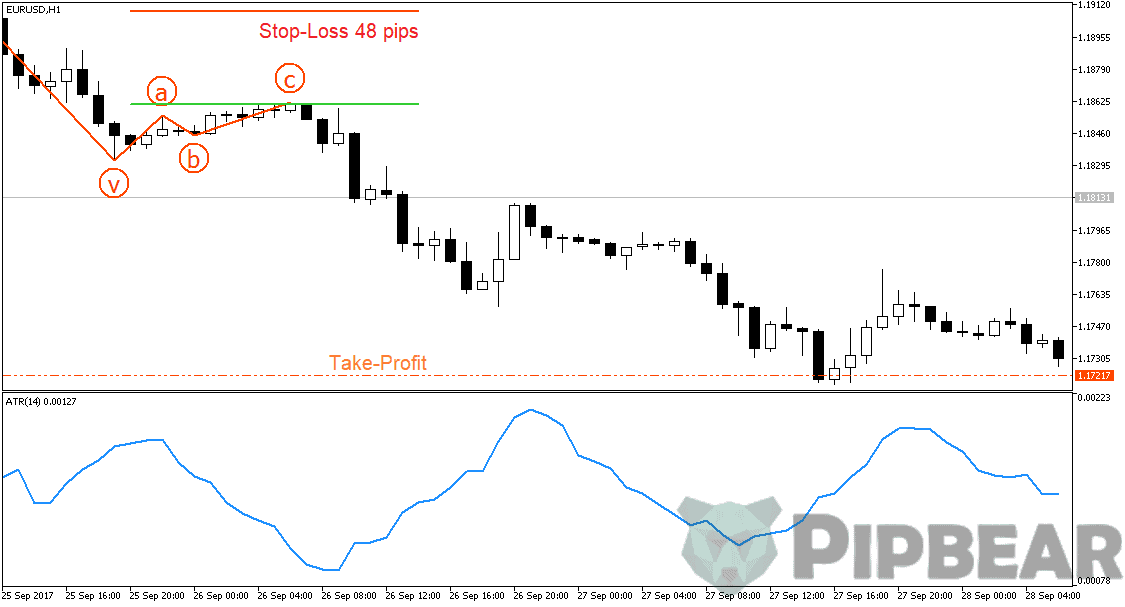
Then one higher minimum and a higher maximum should appear on the chart. Then you need to stretch the Fibonacci grid from the wave B – 0% at the end of B wave and 100% at the beginning. Wait until the price reaches 161.8%. You can set the pending short order if you want to.

Use the triple value of the current ATR (at the moment of the Fibonacci grid setting) to set the Stop Loss order. Set the Take Profit order, which has to be 3 times larger than the Stop Loss order. You can close the position when the next A-B-C wave retracement appears. So we trade within an endless cycle, we enter into the market at its beginning and exit at its end.
CONCLUSION
The Elliott Waves is a universal and independent trading tool that may bring your great results if you have proper marking skills. Nevertheless, despite it is quite old, the theory has not grown into a full-fledged trading system and the result mostly depends on the subjective perception of a trader. If you want to have a better understanding of the market, the Elliott Wave Theory will help you in training the required skills or become your main trading strategy.


Nice explanation of Elliott wave, however i find elliott wave of limited use in real time
MotiveWave seems to be based on this theory
You still have to find the symbol that works well with this strategy…
What happens when you introduce trading bots? Does this make this wave theory obsolete?
I love eliot wave
Thanks for sharing
Please help with the Eliot wave indicator to help me quickly identify it
thanks a lot… its great class… for beginer like me..
Great mind doing great things