

Today, we will talk about non-indicator trading and once again follow up to the ventilation of support/resistance levels. I’ll show and tell you more about one certain type of level. We call them mirror levels.
Table of Contents
What is the mirror level?
To answer this question, we should remember the general meaning of support and resistance. Support represents the situation in which the price constantly goes down, then reaches a certain price point, and ceases to decline. Resistance shows just the opposite situation: the price constantly rises, then reaches a certain price level and, suddenly, ceases to rise.
It can be represented in graphic form as follows:

Having refreshed the basic knowledge in our memory, we can proceed to the main dish of our program.
Mirror level is the level being both support level and the resistance level for the price in past.
The mirror level is extended and is shown as not just a strip, but as certain area (zone). The real chart would have the same look. Saying “level”, we mean not just a specific price value, but the price range in general. And this area can vary significantly, containing 20, 50, 100 and 200 used points. It entirely depends on the time interval and the current market situation. I recognize the fact of providing similar recommendations in all my articles considering levels, but please pay attention to them, since it is highly important.
I strongly hope that you will understand and remember the foregoing because if you do not regard the levels to be zones there is no point to start trading on them.
And besides, the key advantage of such levels is that they meet and work absolutely in any time slots, ranging from momentary to monthly, and also in any financial markets.
How do the price pivot zone and mirror levels look on the charts?
If the information about schemes is clear, let’s move on to “living” examples. Further I will show several charts of various financial instruments so that you could see that these levels do exist, regardless of the market, the instrument and the time interval.
Let’s start, perhaps, with the beloved Forex exchange market and the most popular currency pair EUR/USD:

This is a 1-hour time frame. The red line identifies a zone that shall be a mirror level since precedently it was both support and resistance for the price.
Another example – GBP/USD pair, Time frame H1. All screenshots are made in the same month as I make this article, don’t think that it’s difficult to find illustrations for mirror levels. I am sure, if you open your platform, the illustrations will come to the surface instantly.

I will not repeat the algorithm, everything is pretty much the same as the previous example. The only thing I want to draw your attention to is that in both cases we have a fake breakdown before the price changes the direction. “Fakeys” is a part of my trading strategy which you can learn in my free trading course on this blog, so I would advise you to watch support and resistance levels in a strategy tester mode, taking notes what happens when the trend changes.
Both examples are made on the h1 timeframe, so right now we are speaking about the intraday trading. Meanwhile we can find the same picture on the D1 frame. This one is Eur/Usd.

How to form a mirror level correctly?
Below I will try to explain my “own” approach in the formation of PZP on price charts in detail. You probably won’t believe me, but it’s very simple! I would say even primitive. In general, do not complicate the trading yourself and keep away from people doing so.
I will show the clue on the example of the British pound.
The first thing to do is to proceed to the weekly chart and to note the swings (fluctuations), i.e., those places where the price stopped/unfolded. They should catch your eye immediately as soon as you open the chart. As a result, we should see something like this:

Then we go down to the daily time frame and see what we’ve got:

Note that I “adjusted” the lines for the extremum points and round levels. This is a very important point! There should always be around a level next to a strong mirror area. Be sure to read my article, completely dedicated to round levels.
The third step is to remember that the level is not just a horizontal line 1 pips wide, but a zone or a price range.
Based on this, we edit the chart layout and get the following result:

Look closely at this chart screenshot and analyze the price behavior on these levels. Watch the way the price breaks the levels and how far away it proceeds after the breakout. Observe where the new movements begin and where they end. Try to see the patterns in the behavior of prices on mirror levels.
After making the layout of the chart, you can also search for the merging of our zones with other tools, for example, retracement levels (Fibonacci levels), dynamic levels (moving averages) and graphical technical analysis tools (trend lines, shapes, etc.).
This is how Fibonacci Retracement indicator shows levels:
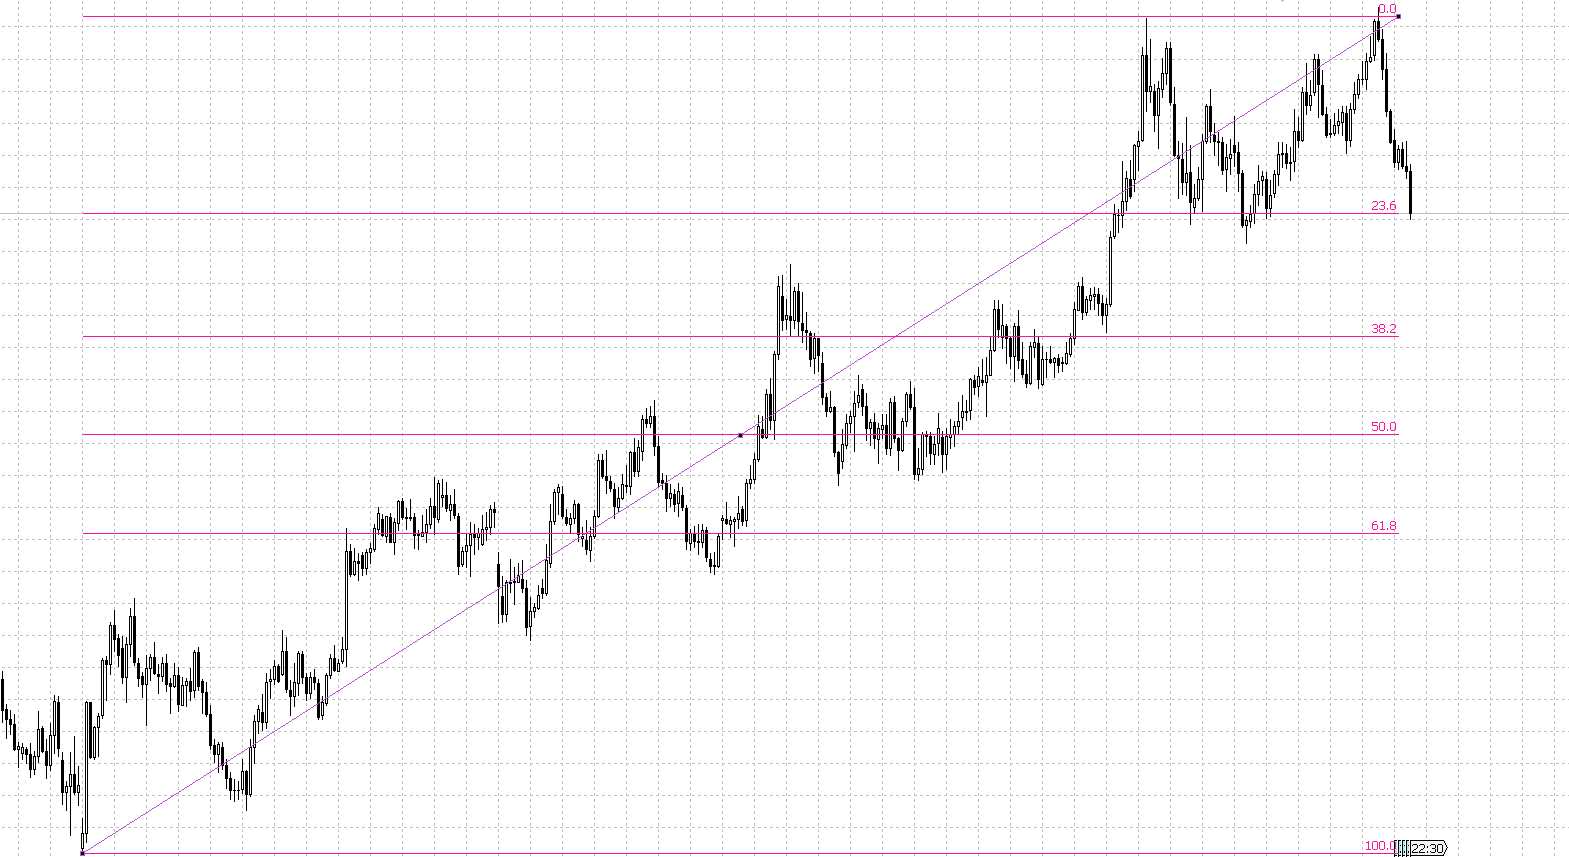
As you can see – very close. Merge the 2 approaches to see the clear picture of where the price may change the direction next time.
How to trade mirror levels?
Trading methods on mirror levels (zones) are no different from trading on other levels. The following options are available:
- level breakout
- release from the level;
- retest (pullback) of the pierced level, i.e. breakout and return to the pierced level.
Naturally, when we open the chart and put all necessary levels on it, the question of what direction to trade arises. Unfortunately, there is no unequivocal answer to this question. In each specific situation, one has to make a decision independently.
Trade by level is not a trading system, but a basis for it. The basis of a very high quality. The goal of any level is to help the trader determine the areas on the chart trading from which the probability of a positive outcome of the transaction increases. In simple terms, the levels give us an answer to the question of where to open a position. But they do not answer the other two important questions, “when” (time) and “where” (direction). The answers to these two questions are to be found in other methods.
Conclusion
Here is the end of the article. I hope you consider it to be interesting and useful for you. Today we got acquainted with a wonderful tool – mirror levels or price pivot zone (PZP). We talked about what these levels are, how to form them correctly on the chart and how to trade on them.
I recommend to practice the knowledge gained and mark out a hundred or two of charts. Yeah, exactly. Levels are not a science, there are no unambiguous rules. Each situation shall be sold out in different ways. In that case, experience and practice play the most important role and you should do your best to gain them.
I also want to emphasize again that the levels/zones are not the Holy Grail, but they’re the keystone of everything of the basics. Either way, you will come to them, it’s just a matter of time.


Pure genius pouring out here…. Thanks thanks
Always enjoy your tutorials. to learn something new…. Today I learnt about zones
Thank you for your kind explanation….. I think its wiser to think of support and resistance zones rather than just support and resistance lines
Which is the best charting tool to help identify all these zones?
Hi there, Is there any truth that it can be easier to draw your support and and resistance zones using a line chart? I read some where that using a line chart to remove the noise when drawing these zones make it a bit more obvious on where to draw them.
I am very much impressed by your content here online…. Just a quick question, being a crypto currency trader how best can I leverage on this
Thanks for your kind words
Thumbs up