

Forex rectangle is a pattern which is formed on a chart when the price is between parallel (horizontal) levels of support and resistance.
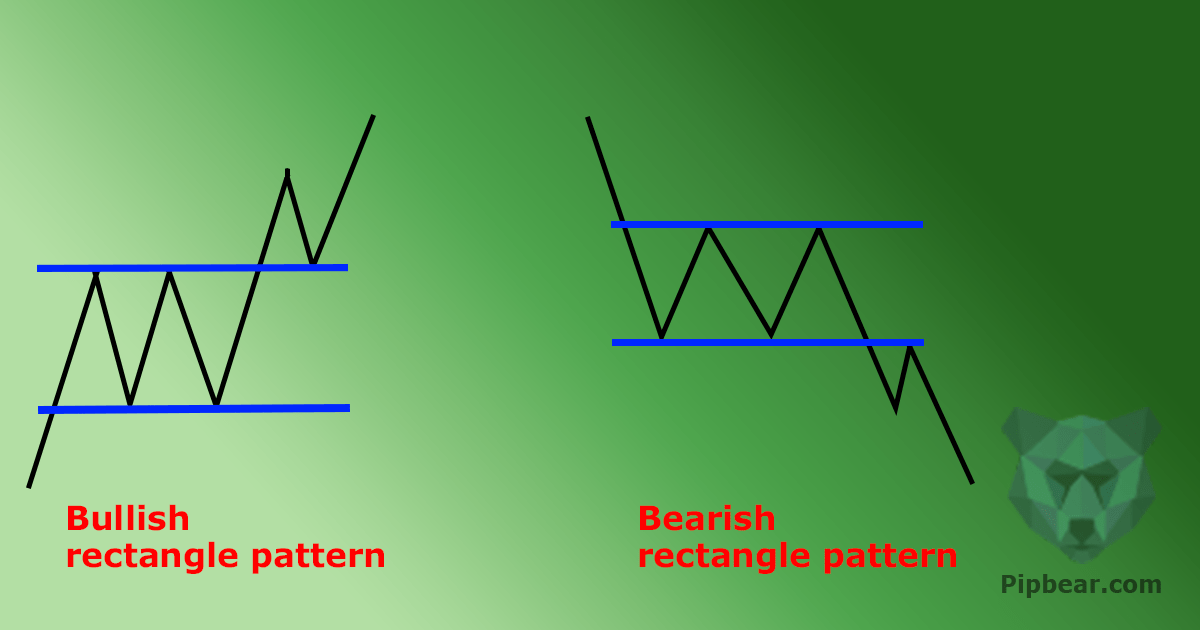
This pattern shows the period of market consolidation and indecision of both buyers and sellers. They try to compete with each other, but no one can prevail. However, the break of the rectangle usually results in a sharp move upside or downside.
Before reading the article and writing your questions in the comments section, I recommend to watch this video. It’s not long but covers the biggest part of questions on the topic.

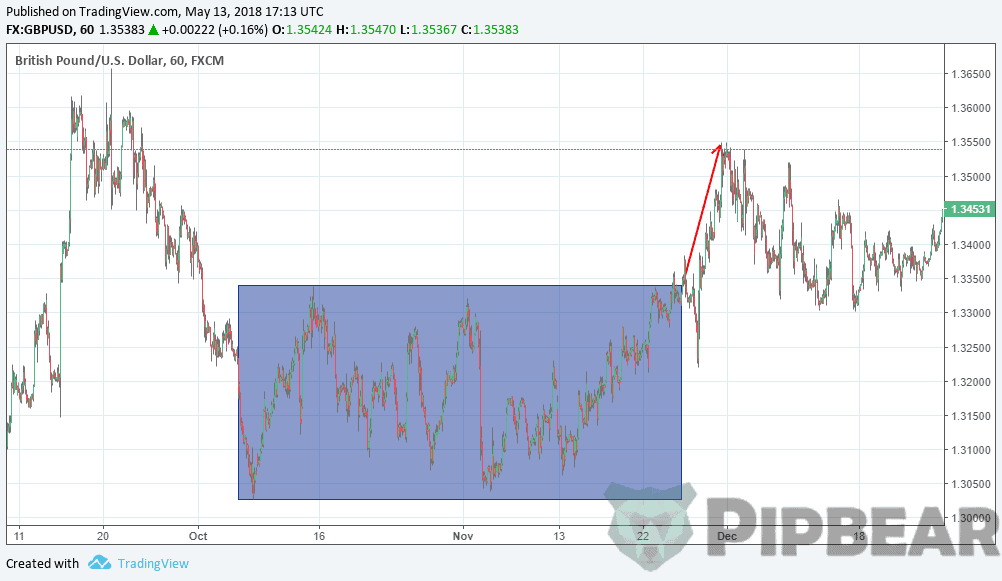
The price will test the support and resistance several times before finally breaking it. When this happens, we will observe a sharp change in prices for a currency pair and it does not matter where the price goes — up or down (Picture 1).
In the example shown above, you can see that the currency pair movement was limited to two key levels which were parallel to each other. We need to wait for a moment when the price breaks through one of these levels, and then it’s time to get ready for the journey. When you have defined a rectangle, you must trade outside it only! Advice is to insert your stop loss inside the rectangle as soon as the price trades and closes outside the rectangle.
Forex bearish rectangle
A bearish rectangle is formed when a downside trend is observed in the market, after which consolidation within a rectangle takes place. This is because sellers need a small rest before continuing their push to the downside. In the end, do not forget that not one move in the market happens vertically but with breaks and corrections.

In this example (Picture 2), the price broke the lower rectangle bound and continued the decline. We could get a good profit if placing an order to sell under the bottom border of the rectangle.

One piece of advice on the profit determination: if the price breaks through support, then the downward movement will be equal to the movement which preceded forex rectangle formation (Picture 3). Often the price will move below the target, that’s why you will have the opportunity to get additional profit!
Forex bullish rectangle
Now let’s examine the rectangle, which is formed in the bullish market. After the uptrend, the price pauses in the upward movement to consolidate for some time. What do you think about the price’s further movement?
If your answer was «up», you were right. Price broke the rectangle and continues to the upside.
See the way the price moved after the rectangle’s upper border breakdown. If we had ordered the purchase just above the upper limit, then we would have had a chance to earn some money. Again, place your SL inside the rectangle in case the price action returns and creates a false breakout. The price moves to the height of the previous movement.


All this time I have been trading triangle without actually knowing it…… Thank you I will improve on it
Price action for me forms the basis of any trading…..any price action am for it though I only trade pinbars
Coach this is obviously amazing
VIVA!!!…… thank you for sharing such powerful insights
Coach this is obviously amazing
What does a triangle have to do with forex, I think we need to focus on the solid, universally acceptable priceactions. They have a huge following and therefore, self fulfilling.
I cant agree more with you Admin
Some of these strategies, never heard of them
Thank you…. Amazing content