The Turtle Strategy is an iconic trading method that has earned millions of dollars for traders all over the world. It was implemented as an experiment to prove that any person can become a successful trader if they follow the rules. With this strategy, you’ll discover new money-making opportunities. Despite its respectful age, the Turtle strategy can teach you a few useful lessons, giving you a better understanding of the essence of price action and big trends.
Before reading the article and writing your questions in the comments section, I recommend to watch this video. It’s not long but covers the biggest part of questions on the topic.
Table of Contents
Key Features
Platform: Any
Instruments: Currency Pairs, Gold, stocks, commodities, indexes
Timeframe: D1
Trading time: Around the clock
More information
- “Inside the Mind of the Turtles” by Curtis M. Faith. Download the e-book.
- “The Complete Turtle Trader” by Michael W. Covel
- How to install indicators on MT4
- How to install strategies
Background
Many years ago, traders Richard Dennis and William Eckhardt argued. They wondered whether a common person can learn how to trade simply by following the rules of the selected trading system.
While Richard Dennis believed it was possible, William Eckhardt was of the opposite opinion. According to him, you need to have a special talent (gut feeling) to be a trader.
To find the truth, the two traders decided to make an experiment. Richard Dennis published an ad and selected a random group of people to teach them his trading system. At the end of the training course, the best students were given certain amounts of money to trade. Can you imagine the result? Without Dennis’s guidance, some of his students made millions of dollars. At the same time, other students suffered devastating losses. All of them traded in the same market, at the same time, and used the same trading system.
This experiment proves that a trading system is not everything. The success of trading also depends on the trader.
In other words, it doesn’t matter how much you know. If you can’t apply your knowledge in real life, you’re not as smart as you might have thought.
In this article, we’ll scrutinize the system Richard Dennis taught his students. Let’s try to find out why some traders lost their money while others became millionaires.
Complementary indicators
- Azzx_donchian(Donchian Channels)
This indicator plots channel bands using highs and lows over n periods (days).
If n equals 20 days, the indicator shows the prices of the highest highs and lowest lows for the last 20 bars. The same scheme is applied for 55 days. The Donchian channel is a very simple tool. You can easily draw a channel band on a piece of paper. Channel bands are plotted for three time periods: 55 days, 20 days, and 10 days.
- TheClassicTurtleTrader (Turtle)
While you can identify breakouts yourself, it will be both faster and easier to use additional indicators for that purpose.
TheClassicTurtleTrader identifies breakouts as red and blue points. Entries and exits are shown with arrows.
The indicator is plotted on the chart twice. In the first case, the period is 20 and the stop period is 10. In the second case, the period is 55 and the stop period is 20.
You won’t need any more tools. The Donchian Channels and the Classic Turtle Trader are quite enough for successful trading.
Let’s add the Classic Turtle Indicator on the chart to get a clear understanding of the situation:

The points can be also used as signals as the channel continues to rise or fall over the last n days.

- Turtle
The Turtle Indicator paints the breakout zones of 10-, 20-, and 55-day channels. Plus, it indicates entry points with arrows and exit points with ticks.

The candle plots a medium-/long-term trend.

On this chart, we’re dealing with a not too strong downtrend.
Here we’re using the default settings. You can change the display settings for a 55-day channel.
- ATR
ATR is a standard indicator with the default period of 20.
Entry rules
Two trading methods use the breakout of the Donchian channel. You can open a trade as soon as the price breaks out of the channel, without waiting for the candle to close.
Conditions for a short-term entry:
— The price breaks out of a 20-day Donchian channel.
— The previous trade (regardless of whether you opened a position or not) was a losing one.
If the previous trade closed with a profit, you don’t make an entry. If it turns out that the breakout is a winning one, you need to open a trade once the price breaks out of a 55-day channel.
Below you can see a daily chart for EUR/USD.

The green lines identify the 20-day Donchian channel.
Once the price breaks out of the channel, you make an entry.
Conditions for a long-term entry:
-The price breaks out of a 55-day Donchian channel.
Please note that this time you don’t need to apply the filter we used in the example above.
Stop loss
If you’re trading Forex, you can use a simplified calculation formula for the Turtle strategy:
ATR (20) * 2
Back in the day, “the Turtles” didn’t place stop orders. Why? They didn’t want the broker to know they were trading big positions. Instead of placing an order, they monitored the price and waited for the breakout to close a trade.
The traders watched closely that losses didn’t exceed certain limits (depending on the volatility conditions). You can say that “the Turtles” used imaginary stop losses.
As we don’t have billions of dollars to trade, we do need real-life stop losses.
To calculate a stop loss, you need to add the ATR indicator on your chart:

In the last trade, stop loss would be at 280 points:

The numbers are so big because we’re looking at daily charts.
By placing this stop loss, we play it safe. As we follow strict exit rules (see below), stop losses are hardly ever activated.
We need a stop loss to protect our account from sharp price fluctuations during the day.
Exit rules
If there is an entry, there must be an exit.
- If you made an entry at the breakout of the 20-day channel, you need to exit at the breakout of the opposite 10-day channel.
- If you made an entry at the breakout of the 55-day channel, you need to exit at the breakout of the opposite 20-day channel.
- In the case with the 20-day channel, “the Turtles” closed the trade at the breakout of the 10-day channel. On the chart below, it has red boundaries:

The complementary indicator shows the exit point.
You can see a blue point in the place where the price broke the low of the 10-day channel:
If you point a cursor at this point, you’ll see the name of the indicator, time, and warning to exit long positions.
- As for the 55-day channel, you need to exit at the breakout of the 20-day channel.
Let’s open a short trade and take a close look at it.
On the chart below, you can see a breakout of the 55-day channel:

The marked point indicates the breakout of the 20-day channel upwards. Here we would have to exit the trade:

This is how we make exits. Be sure to closely monitor the indicators and wait for the entry and exit signals.
Additional orders
Additional orders are placed every 0.5 ATR from the entry point.

This is where we would be able to enter the market. ATR would be at 140 points. 0.5 ATR amounts to 70:

Every 70 points, we would place a new order for an entry in the same direction.
Our orders would look like this:

For any other ATR value, we would calculate the interval for additional orders as half of that value.
Money management
Now let’s talk about money management.
- Risk per trade is 1%
- Additional orders take the risk per trade down to 25%
“The Turtles” never risked more than 1% of their deposit per 1 trade. If you’re using additional orders, you should risk ca. 0.25% of your deposit per 1 trade.
As for stop losses for additional orders, they are calculated exactly as described above. Once your additional order is activated, the stop loss for your position shifts up or down.
I’m anticipating loads of comments regarding a too low risk per trade. The one thing to understand here is that “the Turtles” traded plenty of instruments on multiple markets. In case of a losing streak, they still managed to stay in the game. This is what money management is all about.
Examples of trades
Let’s take a look at some market entry situations.
- The previous entry occurred at the breakout of the 20-day channel. The trade was closed with a small profit of about 15 points:

The trade, which we had opened at the breakout of the 55-day channel, would close once the stop loss is activated:

Note that we wouldn’t open a long trade at the last high at the breakout of the 20-day channel. Why? Because the previous breakout of the 20-day channel was a winning one.
- Let’s take a look at another breakout. It looks pretty good:

Let’s see whether the previous breakout was profitable. For the breakout to be considered losing, the price must move against our potential trading direction by at least 2 ATR:

We can see that the price didn’t move that distance. However, it broke out of the 10-day channel and the trade closed with a loss.

This means we can take the signal and open a trade.
- Let’s analyze the signal that would allow us to make a breakout entry and get more profit:

The previous signal was a losing one. We’re looking at a clear reversal which means we could make an entry once the candle closes:

Here we need a stop loss to limit our potential losses. ATR is currently at 47 points so we would place a stop loss at about 100 points.
We would hold our position till the breakout of the 10-day channel:

The red point shows us when to close the trade.
We would exit the market with a profit of 630 points:

These are the kinds of trends the Turtle strategy focuses on.
- Now let’s analyze the entries at the breakout of the 55-day channel.
As I’ve already said, if there is a breakout of the 55-day channel, we open a position, regardless of whether the previous trade was winning or not. We exit the market at the breakout of the 20-day channel.
For convenience, I recommend using 2 charts.
Here the previous entry occurred sometime after the entry at the breakout of the 20-day channel:

Stop loss is calculated like before. We place a stop loss at about 92 points:

We would hold the position for a long time.
Let’s find out how much we could make:

This trade would bring us 2,300 points, with a stop loss at 100 points. This means that our profit would be 23 times bigger than our stop loss!
It would be one hell of a trade! This is how you can benefit from long-term trends.
Prepare to face plenty of false signals but they are part of the deal.
“The Turtles” only had 3-4 vastly profitable trades a year. Although they traded multiple instruments, these few trades earned them the most of their income.
Lessons from “the Turtles”
1) Trade with an edge. Find a strategy that brings profits in the long-term.
2) Manage your risks. Manage your risks to stay in the game longer and enjoy a winning streak.
3) Be consistent. Follow the entry rules to reach your goal and earn a profit.
4) Keep it simple. Simple trading systems tend to be more reliable and time-tested.
2010 Trends

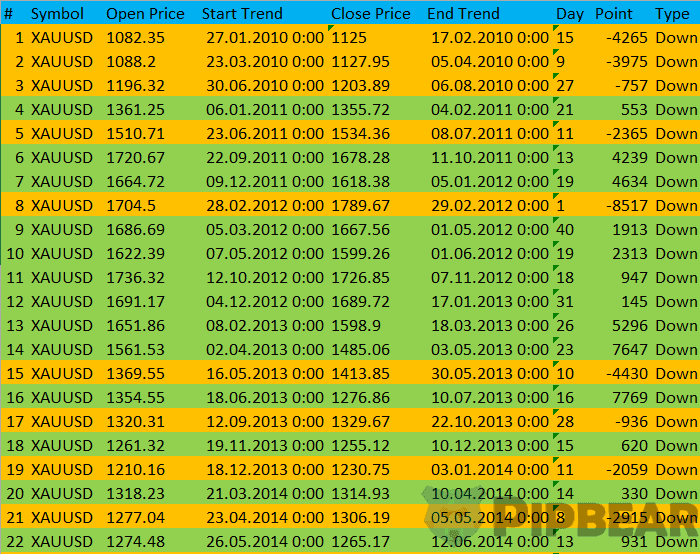
The inventor of the Turtle indicator made a list of all trends following the breakout of the 20-day channel starting from 2010. A trend is considered to end once it rebounds to the opposite 10-day channel. The calculations are made for the following currency pairs: EURUSD, GBPUSD, USDCHF, NZDUSD, USDJPY, USDCAD, AUDUSD, EURGBP, GOLD и SILVER.
Attention! Listed in the table are ALL breakouts of the 20-day channel, with the trend ending once it returned to the 10-day channel. These are NOT entry points according to the Turtle strategy. The additional entry condition (the previous trade must end in a loss) and the breakout of the 55-day channel were not taken into account.
Downtrends are listed in Table 1. Uptrends are featured in Table 2.
Legend:
1) # — ordinal number;
2) Symbol — currency pair;
3) Open Price — trend start price (breakout of the 20-day channel);
4) Start Trend — trend start time;
5) Close Price — close price (rebound to the opposite 10-day channel);
6) End Trend — trend end time;
7) Day — trend duration (days);
8) Point — points between entry price and close price;
9) Type — type of trend (downtrend/uptrend).
10) Point total.
This information offers a good playground for experimentation. I bet you already have a couple of great ideas.
Conclusion
The Turtle strategy is a clear proof that long-term trends are not be ignored. Long-term trends offer amazing money-making opportunities and require little effort. While intraday trading with its instant profits is also very attractive, you might want to consider combining short-term and long-term trading.


Quite a complex system
minute chart ?
Do you think this strategy will work well in intraday trading such as on a 5 minute chart ?
Wait, how do the turtles choose which market would breakout, how?
Your presentation just changed my trading ideeas , in a good way. Thx 4 your presentation.
Awesome job
I will try this out
Admin put this on myfxbook we review it
Forex is so complex I guess…..
Phew…. Am following….. to the end
I like how the exact same system made a fortune for some people and broke others because “you have to know how to apply it”, not because trading is gambling and no “system” actually works reliably.
So true