

I am sure you are familiar with technical analysis and the trend lines in particular, which is considered one of the most popular classic tools. However, it has a typical drawback of any other chart technical analysis tool, which can undercut all the benefits. Technical analysis is very subjective.
Before reading the article and writing your questions in the comments section, I recommend to watch this video. It’s not long, but covers the biggest part of questions on the topic.
What if I tell you that there is a method, which will let you formalize the rules of drawing the trend lines and make the whole process as objective as possible? It is called “the method of creating the trend lines by Victor Sperandeo and 1-2-3 change of trend” and named after the trader who described and formalized it. This article will be devoted to him.
Before we start talking about the Sperandeo method, I would like to share my experience and my story of studying it. I was using the trend lines (and the channel lines) as my main tool for market analysis for quite a long time. I studied the chart history over a long period. After that, I practiced trading both on the demo and real accounts. Each time I was marking a chart I couldn’t help but thinking “Am I doing it right? Did I pick the right points to draw the trend lines?” Of course, you learn to trust yourself and your vision of the market with practice but there is always a piece of subjectivity in your analysis.
Years later, I learned about the methods of non-indicator trading based on the Price Action strategy. Once I stumbled across the method of creating the trend lines by Victor Sperandeo. In a way, it was quite a discovery for me. I do recommend you to pay attention to it since I consider this method one of the few tools that truly work in modern trading.
Table of Contents
Trend Lines Creation Method by Victor Sperandeo
Let’s talk about the good old technical analysis. According to its rules, you need to connect two subsequent extremes to draw a trend line. You are to connect the minimal point with the line in case of an uptrend and connect the maximal points in case of a downtrend.
Let’s draw it schematically on the figure below:
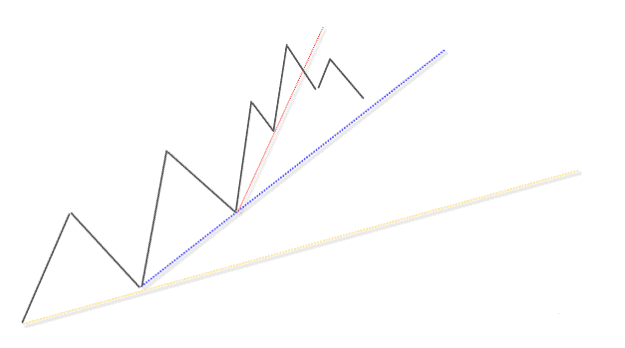
I have made a classic chart on the scheme and created as many as three trend lines instead of one. Which one of these three lines is correct? Now you are facing subjectivity of technical analysis. These lines are created in the right way. However, don’t forget that this is a scheme with an ideal chart. We all know that (for some reason) the things don’t go the way it is written in the books and it is not so easy to create a trend line correctly.
For example, look at the screenshot of the chart’s marking, which I once added to the article about the trend lines. I do also recommend subscribing to my newsletter, downloading and watching a webinar dedicated to this (and not only) topic.

How did do you like it? Of course, I have drawn many of the lines wrong but we can’t get rid of all the lines anyway. In turn, the Sperandeo method will empower us to create one single line on the chart, which will help us to determine the trend’s direction.
Step-by-Step Algorithm of Trend Lines Creation under the Victor Sperandeo Method
Before writing a new article, I always go through dozens of websites and analyze the information. This article is of no exception and I have looked through several sites concerning this topic. I was surprised (once again) that absolutely each site contained the algorithm for creating the trend lines, which differs significantly from one in the book “Trader Vic II: Principles of Professional Speculation” (p. 170, Chapter #10, “Applying technical principles of market analysis”).
Let’s get back to the algorithm:
- Step 1. Determine the beginning of the current movement and the first pirce minima for an uptrend (the price maxima for a downtrend), i.e. the minima from which the short-term uptrend has begun (as it is in my example).
- Step 2. Determine the highest maxima to the extent of the analyzed movement.
- Step 3. Determine the highest secondary minima preceding the highest maxima.
- Step 4. Draw a trend line through two minimal points that we have just determined.
- Step 5. Do read carefully now! According to the Sperandeo method, the trend line must be drawn in a way that the price does not cross this line between these two selected points! This is extremely important but for some reason the Internet authors often forget to tell about it.
- Step 6. If the price crosses the trend line, then it should be redrawn. In this case, the point #2 (the highest secondary minima) remains unchanged. To pick the right point #1, you must draw a trend line through each minima points following the lowest one until the price fails to cross the trend line.
Let’s see an example for the bearish market (a downtrend):

Let’s take a closer look at this situation
- Point #1 — the highest maxima of the analyzed chart area. That’s where the short-term bearish trend has begun.
- Point #2 — the lowest maxima of the analyzed chart area.
- Point #3 — the secondary lowest maxima preceding the lowest minima.
- Point #4 — the maxima point, through which we have drawn a trend line (basing on the Sperandeo method). This maximum was chosen since the price stopped to interact with the trend line.
I should also draw your attention to the fact that if the price updates its highest maxima (in case of an uptrend) or the lowest minima (in case of a downtrend) on the chart, then the marking should be remade.
As you can see, the advantage of Victor Sperandeo’s method is that it provides the clear, unambiguous and objective rules for creating the trend lines.
1-2-3 Trend Change
Now we can finally discuss why we need the trend lines, and the trend direction change in particular.
I’ll digress a bit and just remind you that the trend reversal and the trend direction change are completely different things. The trend reversal implies the trend changing to the opposite one and the change of the trend direction takes into account the flat (sideways trend). These differences are very significant.
Victor Sperandeo suggested a simple rule, which will help you to determine the trend reversal in the early stages without using any technical indicators. This rule was called the “1-2-3 trend change”. Three simple criteria must be followed to apply this rule:
- The trend line must be broken out by the price.
- The price should return to the broken line and test its lowest minima for an uptrend and the highest maxima for a downtrend.
- The price should break out a new local extreme formed after the breakout from the trend line.
To make it clear, Sperandeo added the following picture to his book:

How to Use the Sperandeo Method in Your Trading?
In conclusion, I would like to explain to you how to apply this knowledge in the trade. Let’s get back to the figure on the British pound.
Point #1 is the movement that broke the trend line a formed a new local minimum.
Point #2 is the return (the retest) to the broken line. The next maximum formed at this point mustn’t exceed the previous one. That is the right area to search for the entry point to open the short-term transactions (in my example). However, this is quite an aggressive entry as there is always a chance to get right into the trading range or a complicated retracement. If you like to catch reversals, then such entries are just what you need.
We can say that point #3 is formed when the price updates the previous local minimum and fixes below it. As you can see from my chart, point #3 is not yet formed. Formation of the point #3 gives us another opportunity to open the short-term transactions. We can sell out this situation in two ways:
- For breakout by the stop order;
- For the retest of the broken minimum of point #1.
Breakout trading is not my style, I do not like it and do not recommend it to others since you can easily get a false breakout. The return-risk ratio is fairly poor in this case. Trading at the retest of the broken level is a more conservative option. In this case, you may earn less money but the probability of a positive mathematical expectation of the transaction is much higher.
The first thing you see is that the price has updated the previous maximum so the trend line drawn by the Sperandeo method is no longer relevant and requires revision. Since the maximum was updated, we will take for the second point a secondary minimum that was before the current maximum.
If you had opened a short-term transaction using the aggressive way of trading, you would have gotten a stop-loss order or just gone in the black. If we had followed the conservative way, we wouldn’t have even opened the short-term transactions. Which scenario of consolidation (aggressive or conservative) to choose? I do not have an answer as it all depends on your temper, experience, and trading skills.
Well, I have tried to tell you as much as possible about this wonderful method and share my own experience. I do recommend you to apply this method of creating the trend lines by Victor Sperandeo and the rule of 1-2-3 trend change in your trading. This is a great trading tool though it requires skills and experience. So keep your hands in it using the trading history or the Forex Tester to “get the knack” of it.
By the way, the Sperandeo method is very similar to the Price Action chart pattern, which is called the 1-2-3 pattern. However, I think this is a topic for another article. That’s all. Thank you for your attention.


great video, where can I see more of this strategy…. Propose a book?
nice n clear presentation. may i ask one thing..entry should be when previous high broke or can enter in micro swing also?
Clear and onto the point…. Thank you very much
Cant disagree or agree….. I need more time to see if this strategy can give desired results
Thank you for the awesome job
Great strategy… I will try it out
Well elaborated… agreed
I love this guy! Better than any investor I’ve ever seen on CNBC!
The explanation is very clear and concise, following
Clear examples
Pictures are not visible, I have checked in chrome, edge and internet explorer