

A wedge is a well-known continuation pattern in the technical analysis at Forex. It is rarer to see than flag and pennant, but it often indicates a forthcoming reversal. These models belong to triangles too but have certain special features. One of the features consists in the fact that Wedge pattern may indicate the further developments. For example, ascending Wedge pattern suggests a forthcoming decline, while descending Wedge, on the contrary, notifies on the uptrend beginning.
Wedge is one of the classic technical analysis figures at the top or on the bottom of the market and is considered by experts as a reversal pattern. A wedge is a situation when the market forms a conic price configuration of highs and lows converging in a narrow zone on the chart.
Before reading the article and writing your questions in the comments section, I recommend to watch this video. It’s not long but covers the biggest part of questions on the topic.
Bullish and bearish Wedge
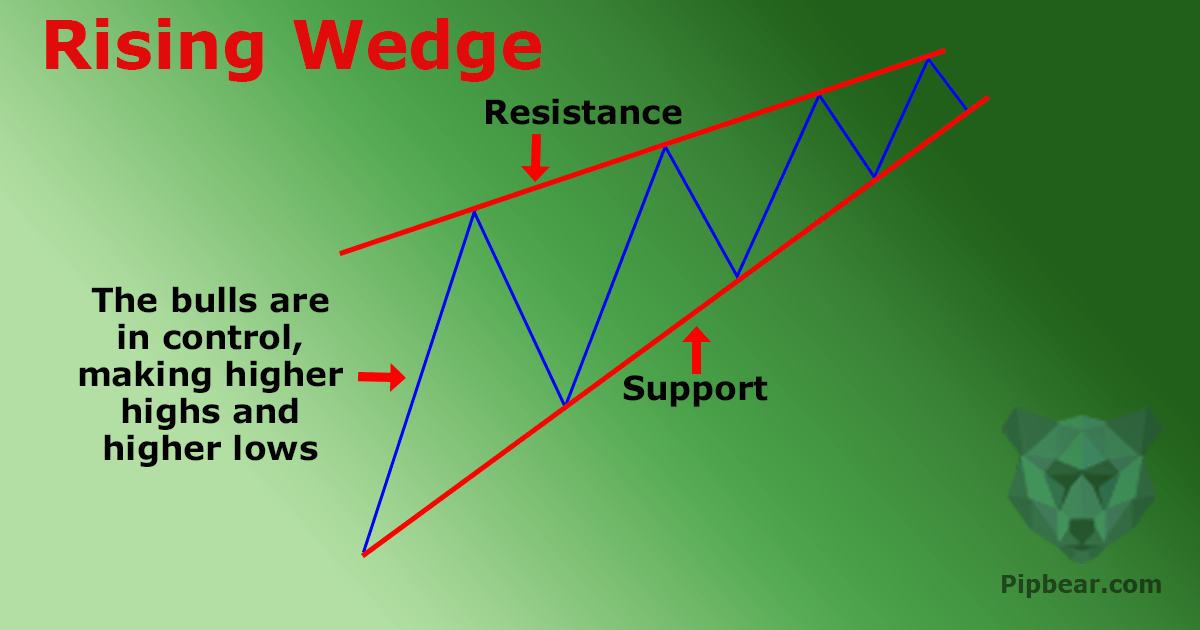
- When the market forms ascending highs and lows with the help of which support and resistance lines can be drawn. This situation occurs in the uptrend once the demand growth stops and the market weights further actions and we can expect its future behavior, whereupon the resistance line is broken in the direction that is opposite to the trend, which forms a bullish wedge.

- When the market makes descending highs and lows which can be connected with support and resistance lines in the bearish trend, whereupon the resistance line is broken and the bearish wedge is formed.
In the stock market, wedges are usually considered for long periods, so hourly and longer timeframes should be considered.
The main technical conditions of formation
- The preceding trend should be broken. Every new high and low should rebuild the order. On the uptrend, every low should be higher than the previous one.
- Resistance or support line which is broken by the price at the wedge formation should be drawn through at least two highs in the bearish market and two lows – in the bullish market. In perfect conditions, the price should touch any of these lines three times.
- The sloping support line in the bearish market should include at least two touches; hence, the resistance line in the bullish market should be drawn through at least two lows.
- The wedge is formed through the price range narrowing.
It is usually preceded by the slowing of prices when the trend does not attract keen interest anymore. Update in any direction does not bring the expected profit anymore. Uncertain jumps give way to a deep pullback.
The market should be entered once the price goes beyond the line and the first wave height is equal to the trade goal. The resistance line has a large enough slope, and the break occurs at a distance of one third from the top.
Wedge is an ambiguous model.
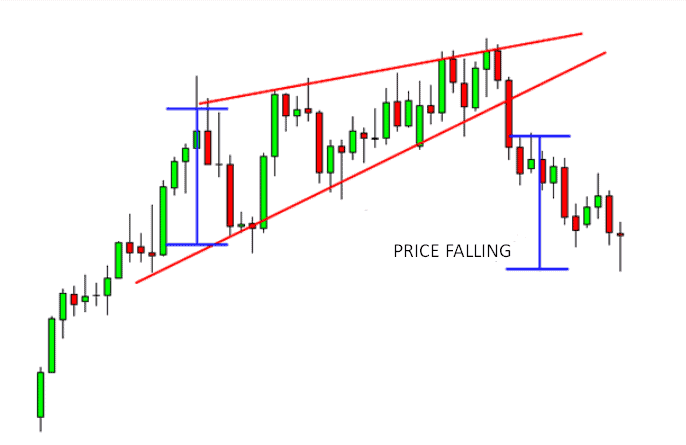
When an ascending wedge appears in the bullish trend, it is rather a reversal pattern leading to a decrease. Good conditions for short positions appear. Rising Wedge is a pattern which is reverse to the descending model. It’s the same triangle, but its peak is directed upwards.
The signal in this case is breaking the bottom facet of the Wedge. This confirms the downtrend. Short position can be opened after the break or once the price tests the lower facet bottom-up and rebounds from it. If the ascending wedge occurs in the bearish trend it is considered that the market pauses before continuing to decline.

Situations in the descending wedge are similar:

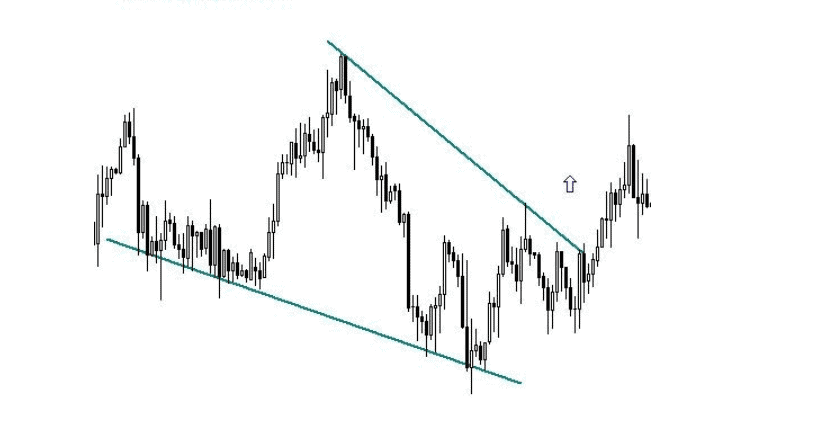
Descending wedge at the uptrend suggests a pause before the continuation of the price growth.

In the figure, you can see a triangle appearing after the downtrend. Its peak is directed downwards. It is formed by several price waves (three or more). The signal for opening a long position appears when the price breaks the upper line of the descending Wedge pattern.
Usually these signals are strong enough to determine the entry point accurately. The figure also shows that the price may return to the upper facet and retest it top down. If this testing proves to be ineffective, a long position can be opened again.


Wow I was just going to ask you if you could make an article on this, thanks for making this series its been super helpful
when we look at wedges for something like Ethereum do we look at BTC/ETH or USD/ETH as they both paint very different pictures
Are these technical indicators only good for daily charts or they work for hourly charts as well?
Would you mind talking of cryptos too?
Which indicators can I use along with this pattern
This really would have benefited from examples of faulty wedges
Your articles are insane,…. Mad love from Egypt
WoW thank you very much!! Interesting and keep learning over here
Great video man!! Thank you for giving us such useful content 🙂
Thank you! You are the best!!!!